Immigrants from Cameroon vs Menominee Male Poverty
COMPARE
Immigrants from Cameroon
Menominee
Male Poverty
Male Poverty Comparison
Immigrants from Cameroon
Menominee
11.2%
MALE POVERTY
44.5/ 100
METRIC RATING
178th/ 347
METRIC RANK
15.3%
MALE POVERTY
0.0/ 100
METRIC RATING
324th/ 347
METRIC RANK
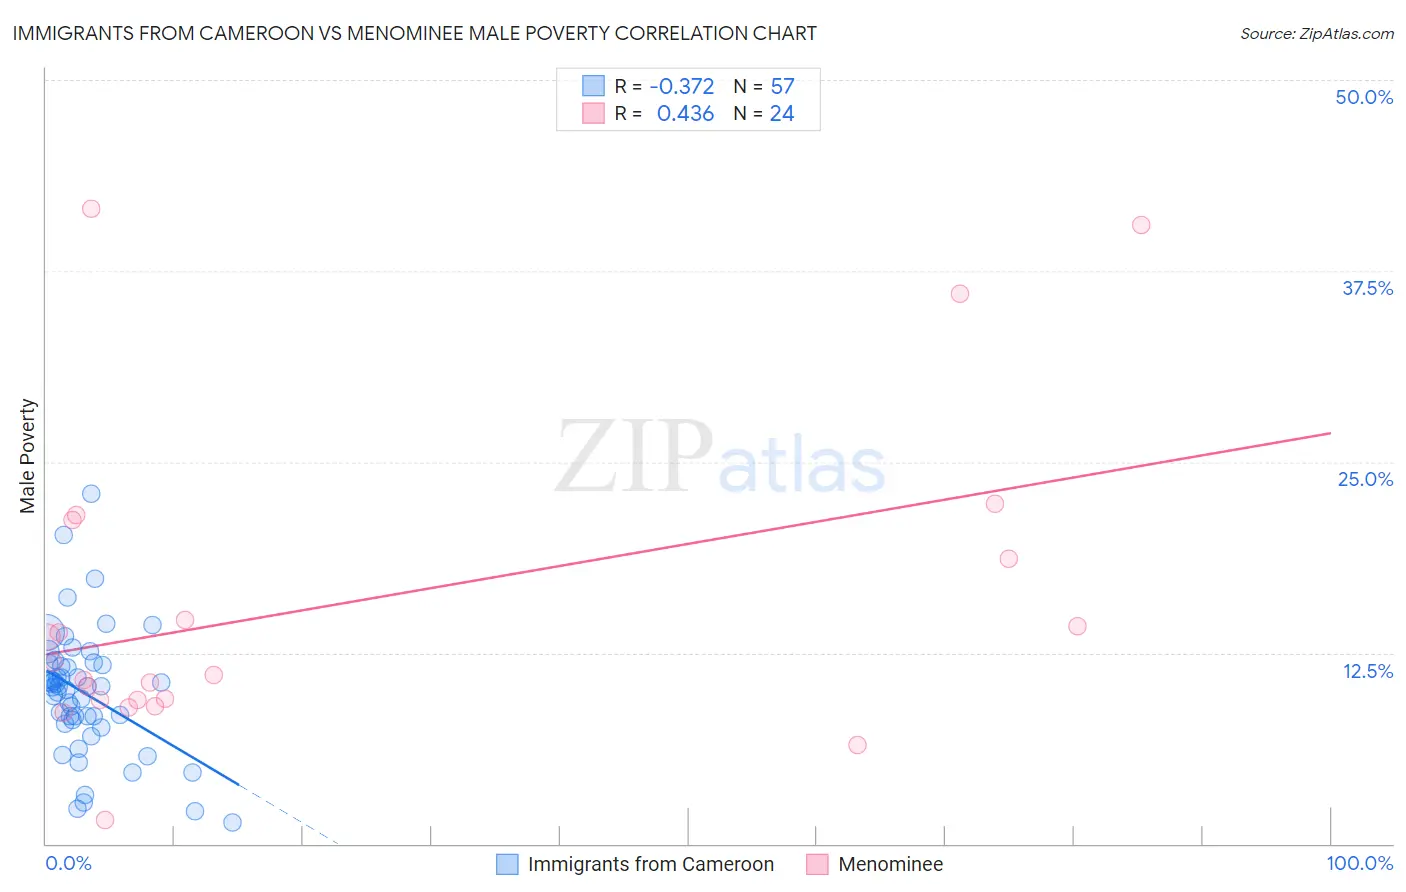
Immigrants from Cameroon vs Menominee Male Poverty Correlation Chart
The statistical analysis conducted on geographies consisting of 130,706,332 people shows a mild negative correlation between the proportion of Immigrants from Cameroon and poverty level among males in the United States with a correlation coefficient (R) of -0.372 and weighted average of 11.2%. Similarly, the statistical analysis conducted on geographies consisting of 45,777,105 people shows a moderate positive correlation between the proportion of Menominee and poverty level among males in the United States with a correlation coefficient (R) of 0.436 and weighted average of 15.3%, a difference of 35.8%.
Male Poverty Correlation Summary
| Measurement | Immigrants from Cameroon | Menominee |
| Minimum | 1.4% | 1.6% |
| Maximum | 22.9% | 41.6% |
| Range | 21.5% | 40.0% |
| Mean | 9.8% | 15.6% |
| Median | 10.3% | 11.5% |
| Interquartile 25% (IQ1) | 8.0% | 9.4% |
| Interquartile 75% (IQ3) | 11.7% | 19.9% |
| Interquartile Range (IQR) | 3.8% | 10.5% |
| Standard Deviation (Sample) | 4.1% | 10.4% |
| Standard Deviation (Population) | 4.1% | 10.2% |
Similar Demographics by Male Poverty
Demographics Similar to Immigrants from Cameroon by Male Poverty
In terms of male poverty, the demographic groups most similar to Immigrants from Cameroon are Lebanese (11.2%, a difference of 0.11%), Immigrants from Fiji (11.2%, a difference of 0.15%), Celtic (11.2%, a difference of 0.29%), Immigrants from Syria (11.3%, a difference of 0.43%), and Immigrants from Morocco (11.3%, a difference of 0.44%).
| Demographics | Rating | Rank | Male Poverty |
| Uruguayans | 51.0 /100 | #171 | Average 11.2% |
| Immigrants | Ethiopia | 50.7 /100 | #172 | Average 11.2% |
| Pennsylvania Germans | 50.5 /100 | #173 | Average 11.2% |
| Immigrants | Oceania | 50.0 /100 | #174 | Average 11.2% |
| Celtics | 47.5 /100 | #175 | Average 11.2% |
| Immigrants | Fiji | 46.0 /100 | #176 | Average 11.2% |
| Lebanese | 45.6 /100 | #177 | Average 11.2% |
| Immigrants | Cameroon | 44.5 /100 | #178 | Average 11.2% |
| Immigrants | Syria | 40.3 /100 | #179 | Average 11.3% |
| Immigrants | Morocco | 40.1 /100 | #180 | Average 11.3% |
| Immigrants | Costa Rica | 39.5 /100 | #181 | Fair 11.3% |
| Mongolians | 39.0 /100 | #182 | Fair 11.3% |
| Kenyans | 38.4 /100 | #183 | Fair 11.3% |
| Immigrants | South America | 36.9 /100 | #184 | Fair 11.3% |
| Immigrants | Afghanistan | 33.3 /100 | #185 | Fair 11.4% |
Demographics Similar to Menominee by Male Poverty
In terms of male poverty, the demographic groups most similar to Menominee are Yakama (15.3%, a difference of 0.18%), Colville (15.2%, a difference of 0.19%), Central American Indian (15.3%, a difference of 0.29%), Kiowa (15.2%, a difference of 0.58%), and Arapaho (15.1%, a difference of 1.3%).
| Demographics | Rating | Rank | Male Poverty |
| Immigrants | Dominica | 0.0 /100 | #317 | Tragic 14.7% |
| Immigrants | Grenada | 0.0 /100 | #318 | Tragic 14.7% |
| U.S. Virgin Islanders | 0.0 /100 | #319 | Tragic 14.7% |
| Immigrants | Congo | 0.0 /100 | #320 | Tragic 14.7% |
| Arapaho | 0.0 /100 | #321 | Tragic 15.1% |
| Kiowa | 0.0 /100 | #322 | Tragic 15.2% |
| Colville | 0.0 /100 | #323 | Tragic 15.2% |
| Menominee | 0.0 /100 | #324 | Tragic 15.3% |
| Yakama | 0.0 /100 | #325 | Tragic 15.3% |
| Central American Indians | 0.0 /100 | #326 | Tragic 15.3% |
| Paiute | 0.0 /100 | #327 | Tragic 15.8% |
| Blacks/African Americans | 0.0 /100 | #328 | Tragic 15.8% |
| Dominicans | 0.0 /100 | #329 | Tragic 16.1% |
| Immigrants | Dominican Republic | 0.0 /100 | #330 | Tragic 16.2% |
| Ute | 0.0 /100 | #331 | Tragic 16.2% |