Immigrants from Albania vs West Indian Child Poverty Among Girls Under 16
COMPARE
Immigrants from Albania
West Indian
Child Poverty Among Girls Under 16
Child Poverty Among Girls Under 16 Comparison
Immigrants from Albania
West Indians
15.8%
CHILD POVERTY AMONG GIRLS UNDER 16
80.7/ 100
METRIC RATING
150th/ 347
METRIC RANK
20.3%
CHILD POVERTY AMONG GIRLS UNDER 16
0.0/ 100
METRIC RATING
282nd/ 347
METRIC RANK
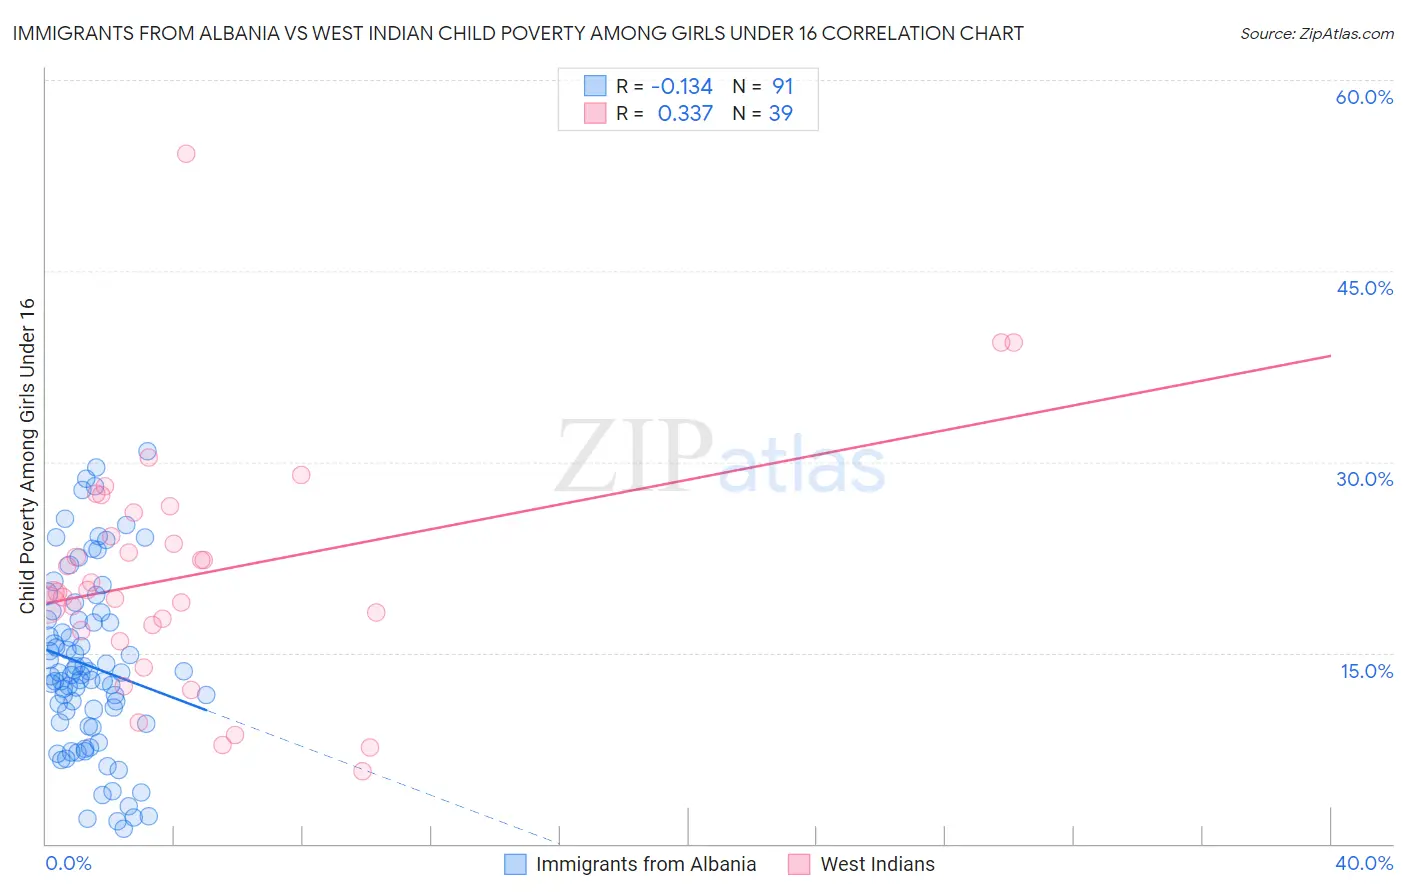
Immigrants from Albania vs West Indian Child Poverty Among Girls Under 16 Correlation Chart
The statistical analysis conducted on geographies consisting of 118,242,796 people shows a poor negative correlation between the proportion of Immigrants from Albania and poverty level among girls under the age of 16 in the United States with a correlation coefficient (R) of -0.134 and weighted average of 15.8%. Similarly, the statistical analysis conducted on geographies consisting of 251,644,082 people shows a mild positive correlation between the proportion of West Indians and poverty level among girls under the age of 16 in the United States with a correlation coefficient (R) of 0.337 and weighted average of 20.3%, a difference of 28.6%.
Child Poverty Among Girls Under 16 Correlation Summary
| Measurement | Immigrants from Albania | West Indian |
| Minimum | 1.2% | 5.7% |
| Maximum | 30.9% | 54.2% |
| Range | 29.7% | 48.5% |
| Mean | 14.0% | 21.2% |
| Median | 13.2% | 19.8% |
| Interquartile 25% (IQ1) | 9.4% | 16.7% |
| Interquartile 75% (IQ3) | 17.6% | 26.0% |
| Interquartile Range (IQR) | 8.2% | 9.3% |
| Standard Deviation (Sample) | 6.9% | 9.4% |
| Standard Deviation (Population) | 6.9% | 9.2% |
Similar Demographics by Child Poverty Among Girls Under 16
Demographics Similar to Immigrants from Albania by Child Poverty Among Girls Under 16
In terms of child poverty among girls under 16, the demographic groups most similar to Immigrants from Albania are Immigrants from Hungary (15.8%, a difference of 0.040%), Venezuelan (15.8%, a difference of 0.10%), Immigrants from Kuwait (15.8%, a difference of 0.24%), Icelander (15.7%, a difference of 0.35%), and Immigrants from Nepal (15.9%, a difference of 0.40%).
| Demographics | Rating | Rank | Child Poverty Among Girls Under 16 |
| Immigrants | Peru | 86.6 /100 | #143 | Excellent 15.6% |
| Israelis | 86.3 /100 | #144 | Excellent 15.6% |
| Welsh | 85.4 /100 | #145 | Excellent 15.6% |
| Samoans | 84.2 /100 | #146 | Excellent 15.7% |
| Slavs | 83.1 /100 | #147 | Excellent 15.7% |
| Icelanders | 82.4 /100 | #148 | Excellent 15.7% |
| Immigrants | Hungary | 80.9 /100 | #149 | Excellent 15.8% |
| Immigrants | Albania | 80.7 /100 | #150 | Excellent 15.8% |
| Venezuelans | 80.1 /100 | #151 | Excellent 15.8% |
| Immigrants | Kuwait | 79.4 /100 | #152 | Good 15.8% |
| Immigrants | Nepal | 78.5 /100 | #153 | Good 15.9% |
| Immigrants | Chile | 76.7 /100 | #154 | Good 15.9% |
| Syrians | 76.7 /100 | #155 | Good 15.9% |
| Immigrants | Fiji | 76.1 /100 | #156 | Good 15.9% |
| Colombians | 76.1 /100 | #157 | Good 15.9% |
Demographics Similar to West Indians by Child Poverty Among Girls Under 16
In terms of child poverty among girls under 16, the demographic groups most similar to West Indians are Senegalese (20.3%, a difference of 0.060%), Yaqui (20.3%, a difference of 0.080%), Immigrants from Cabo Verde (20.3%, a difference of 0.22%), Central American (20.2%, a difference of 0.28%), and Immigrants from Liberia (20.2%, a difference of 0.35%).
| Demographics | Rating | Rank | Child Poverty Among Girls Under 16 |
| Sub-Saharan Africans | 0.0 /100 | #275 | Tragic 20.1% |
| Comanche | 0.0 /100 | #276 | Tragic 20.2% |
| Belizeans | 0.0 /100 | #277 | Tragic 20.2% |
| Barbadians | 0.0 /100 | #278 | Tragic 20.2% |
| Immigrants | Zaire | 0.0 /100 | #279 | Tragic 20.2% |
| Immigrants | Liberia | 0.0 /100 | #280 | Tragic 20.2% |
| Central Americans | 0.0 /100 | #281 | Tragic 20.2% |
| West Indians | 0.0 /100 | #282 | Tragic 20.3% |
| Senegalese | 0.0 /100 | #283 | Tragic 20.3% |
| Yaqui | 0.0 /100 | #284 | Tragic 20.3% |
| Immigrants | Cabo Verde | 0.0 /100 | #285 | Tragic 20.3% |
| Iroquois | 0.0 /100 | #286 | Tragic 20.4% |
| Blackfeet | 0.0 /100 | #287 | Tragic 20.5% |
| Haitians | 0.0 /100 | #288 | Tragic 20.5% |
| Immigrants | Belize | 0.0 /100 | #289 | Tragic 20.6% |