Immigrants from Western Africa vs West Indian Child Poverty Among Girls Under 16
COMPARE
Immigrants from Western Africa
West Indian
Child Poverty Among Girls Under 16
Child Poverty Among Girls Under 16 Comparison
Immigrants from Western Africa
West Indians
19.3%
CHILD POVERTY AMONG GIRLS UNDER 16
0.3/ 100
METRIC RATING
254th/ 347
METRIC RANK
20.3%
CHILD POVERTY AMONG GIRLS UNDER 16
0.0/ 100
METRIC RATING
282nd/ 347
METRIC RANK
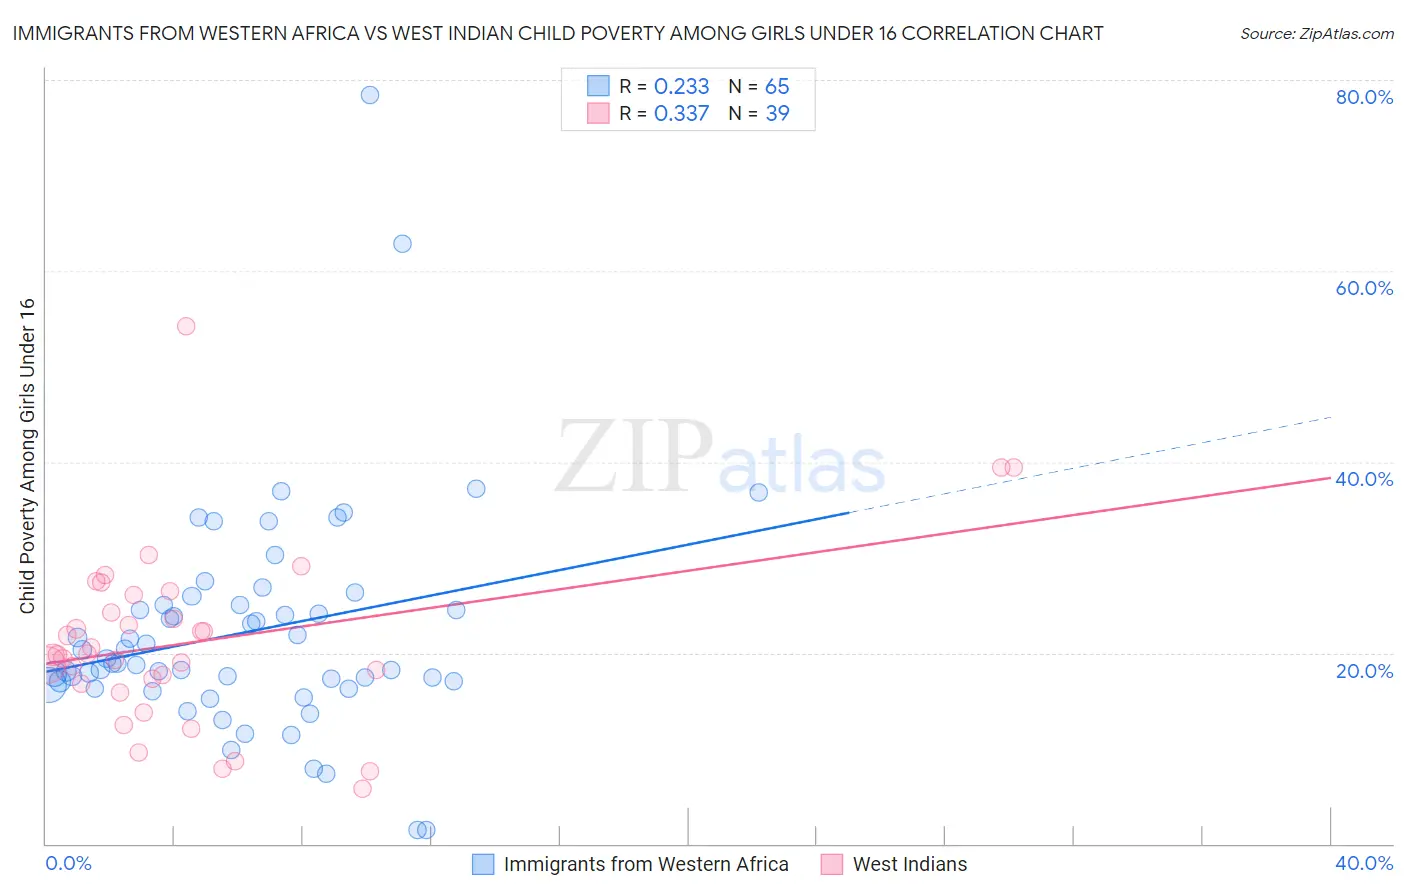
Immigrants from Western Africa vs West Indian Child Poverty Among Girls Under 16 Correlation Chart
The statistical analysis conducted on geographies consisting of 353,292,539 people shows a weak positive correlation between the proportion of Immigrants from Western Africa and poverty level among girls under the age of 16 in the United States with a correlation coefficient (R) of 0.233 and weighted average of 19.3%. Similarly, the statistical analysis conducted on geographies consisting of 251,644,082 people shows a mild positive correlation between the proportion of West Indians and poverty level among girls under the age of 16 in the United States with a correlation coefficient (R) of 0.337 and weighted average of 20.3%, a difference of 5.2%.
Child Poverty Among Girls Under 16 Correlation Summary
| Measurement | Immigrants from Western Africa | West Indian |
| Minimum | 1.4% | 5.7% |
| Maximum | 78.4% | 54.2% |
| Range | 77.0% | 48.5% |
| Mean | 22.1% | 21.2% |
| Median | 18.9% | 19.8% |
| Interquartile 25% (IQ1) | 16.8% | 16.7% |
| Interquartile 75% (IQ3) | 25.0% | 26.0% |
| Interquartile Range (IQR) | 8.2% | 9.3% |
| Standard Deviation (Sample) | 11.8% | 9.4% |
| Standard Deviation (Population) | 11.7% | 9.2% |
Similar Demographics by Child Poverty Among Girls Under 16
Demographics Similar to Immigrants from Western Africa by Child Poverty Among Girls Under 16
In terms of child poverty among girls under 16, the demographic groups most similar to Immigrants from Western Africa are Immigrants from Ecuador (19.3%, a difference of 0.020%), Immigrants from Guyana (19.3%, a difference of 0.060%), Trinidadian and Tobagonian (19.3%, a difference of 0.080%), Immigrants from Middle Africa (19.2%, a difference of 0.26%), and Immigrants from Trinidad and Tobago (19.2%, a difference of 0.30%).
| Demographics | Rating | Rank | Child Poverty Among Girls Under 16 |
| Immigrants | Ghana | 0.5 /100 | #247 | Tragic 18.9% |
| French American Indians | 0.3 /100 | #248 | Tragic 19.2% |
| Potawatomi | 0.3 /100 | #249 | Tragic 19.2% |
| Cape Verdeans | 0.3 /100 | #250 | Tragic 19.2% |
| Immigrants | Trinidad and Tobago | 0.3 /100 | #251 | Tragic 19.2% |
| Immigrants | Middle Africa | 0.3 /100 | #252 | Tragic 19.2% |
| Immigrants | Guyana | 0.3 /100 | #253 | Tragic 19.3% |
| Immigrants | Western Africa | 0.3 /100 | #254 | Tragic 19.3% |
| Immigrants | Ecuador | 0.3 /100 | #255 | Tragic 19.3% |
| Trinidadians and Tobagonians | 0.2 /100 | #256 | Tragic 19.3% |
| Guyanese | 0.2 /100 | #257 | Tragic 19.4% |
| Salvadorans | 0.2 /100 | #258 | Tragic 19.4% |
| Ottawa | 0.2 /100 | #259 | Tragic 19.4% |
| Mexican American Indians | 0.2 /100 | #260 | Tragic 19.5% |
| Vietnamese | 0.2 /100 | #261 | Tragic 19.5% |
Demographics Similar to West Indians by Child Poverty Among Girls Under 16
In terms of child poverty among girls under 16, the demographic groups most similar to West Indians are Senegalese (20.3%, a difference of 0.060%), Yaqui (20.3%, a difference of 0.080%), Immigrants from Cabo Verde (20.3%, a difference of 0.22%), Central American (20.2%, a difference of 0.28%), and Immigrants from Liberia (20.2%, a difference of 0.35%).
| Demographics | Rating | Rank | Child Poverty Among Girls Under 16 |
| Sub-Saharan Africans | 0.0 /100 | #275 | Tragic 20.1% |
| Comanche | 0.0 /100 | #276 | Tragic 20.2% |
| Belizeans | 0.0 /100 | #277 | Tragic 20.2% |
| Barbadians | 0.0 /100 | #278 | Tragic 20.2% |
| Immigrants | Zaire | 0.0 /100 | #279 | Tragic 20.2% |
| Immigrants | Liberia | 0.0 /100 | #280 | Tragic 20.2% |
| Central Americans | 0.0 /100 | #281 | Tragic 20.2% |
| West Indians | 0.0 /100 | #282 | Tragic 20.3% |
| Senegalese | 0.0 /100 | #283 | Tragic 20.3% |
| Yaqui | 0.0 /100 | #284 | Tragic 20.3% |
| Immigrants | Cabo Verde | 0.0 /100 | #285 | Tragic 20.3% |
| Iroquois | 0.0 /100 | #286 | Tragic 20.4% |
| Blackfeet | 0.0 /100 | #287 | Tragic 20.5% |
| Haitians | 0.0 /100 | #288 | Tragic 20.5% |
| Immigrants | Belize | 0.0 /100 | #289 | Tragic 20.6% |