Immigrants from Burma/Myanmar vs Immigrants Poverty
COMPARE
Immigrants from Burma/Myanmar
Immigrants
Poverty
Poverty Comparison
Immigrants from Burma/Myanmar
Immigrants
14.2%
POVERTY
0.2/ 100
METRIC RATING
251st/ 347
METRIC RANK
13.2%
POVERTY
4.3/ 100
METRIC RATING
212th/ 347
METRIC RANK
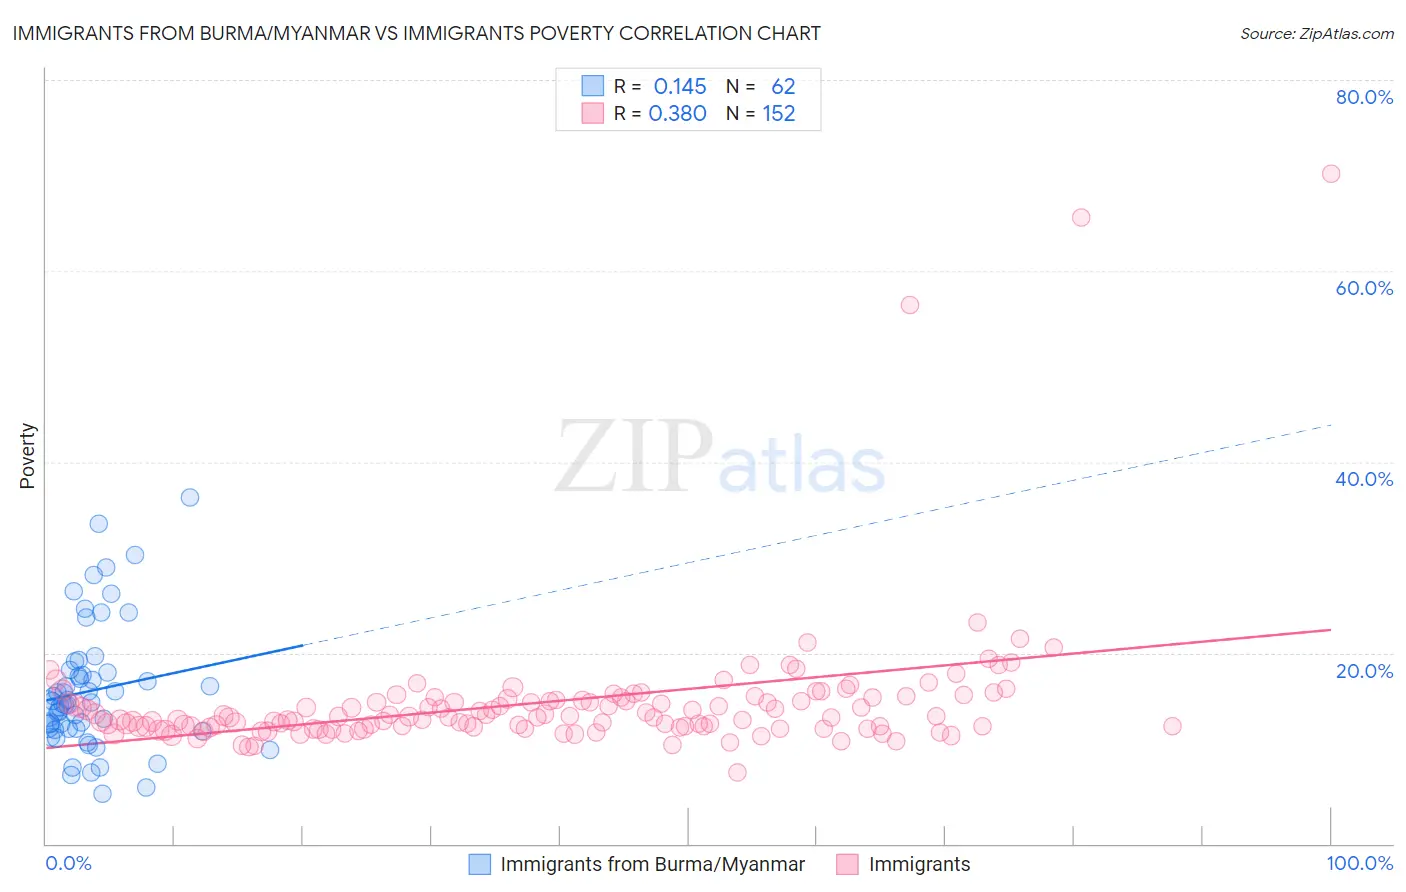
Immigrants from Burma/Myanmar vs Immigrants Poverty Correlation Chart
The statistical analysis conducted on geographies consisting of 172,278,151 people shows a poor positive correlation between the proportion of Immigrants from Burma/Myanmar and poverty level in the United States with a correlation coefficient (R) of 0.145 and weighted average of 14.2%. Similarly, the statistical analysis conducted on geographies consisting of 576,811,759 people shows a mild positive correlation between the proportion of Immigrants and poverty level in the United States with a correlation coefficient (R) of 0.380 and weighted average of 13.2%, a difference of 7.3%.
Poverty Correlation Summary
| Measurement | Immigrants from Burma/Myanmar | Immigrants |
| Minimum | 5.2% | 7.5% |
| Maximum | 36.2% | 70.2% |
| Range | 31.0% | 62.7% |
| Mean | 16.0% | 14.8% |
| Median | 14.7% | 13.3% |
| Interquartile 25% (IQ1) | 12.0% | 12.3% |
| Interquartile 75% (IQ3) | 17.9% | 15.1% |
| Interquartile Range (IQR) | 5.9% | 2.8% |
| Standard Deviation (Sample) | 6.6% | 7.5% |
| Standard Deviation (Population) | 6.6% | 7.4% |
Similar Demographics by Poverty
Demographics Similar to Immigrants from Burma/Myanmar by Poverty
In terms of poverty, the demographic groups most similar to Immigrants from Burma/Myanmar are Cree (14.2%, a difference of 0.090%), Spanish American Indian (14.2%, a difference of 0.11%), Immigrants from Trinidad and Tobago (14.2%, a difference of 0.22%), Immigrants from Ghana (14.2%, a difference of 0.39%), and Immigrants from El Salvador (14.3%, a difference of 0.47%).
| Demographics | Rating | Rank | Poverty |
| Nepalese | 0.3 /100 | #244 | Tragic 14.0% |
| Immigrants | Sudan | 0.3 /100 | #245 | Tragic 14.1% |
| Potawatomi | 0.3 /100 | #246 | Tragic 14.1% |
| Liberians | 0.2 /100 | #247 | Tragic 14.1% |
| Immigrants | Western Africa | 0.2 /100 | #248 | Tragic 14.1% |
| Immigrants | Ghana | 0.2 /100 | #249 | Tragic 14.2% |
| Cree | 0.2 /100 | #250 | Tragic 14.2% |
| Immigrants | Burma/Myanmar | 0.2 /100 | #251 | Tragic 14.2% |
| Spanish American Indians | 0.2 /100 | #252 | Tragic 14.2% |
| Immigrants | Trinidad and Tobago | 0.2 /100 | #253 | Tragic 14.2% |
| Immigrants | El Salvador | 0.1 /100 | #254 | Tragic 14.3% |
| Immigrants | Ecuador | 0.1 /100 | #255 | Tragic 14.3% |
| Mexican American Indians | 0.1 /100 | #256 | Tragic 14.3% |
| Trinidadians and Tobagonians | 0.1 /100 | #257 | Tragic 14.3% |
| Ottawa | 0.1 /100 | #258 | Tragic 14.3% |
Demographics Similar to Immigrants by Poverty
In terms of poverty, the demographic groups most similar to Immigrants are Immigrants from Panama (13.3%, a difference of 0.13%), Bermudan (13.3%, a difference of 0.39%), Moroccan (13.2%, a difference of 0.45%), Japanese (13.3%, a difference of 0.65%), and Nonimmigrants (13.3%, a difference of 0.65%).
| Demographics | Rating | Rank | Poverty |
| Tsimshian | 9.2 /100 | #205 | Tragic 13.0% |
| Immigrants | Eastern Africa | 7.0 /100 | #206 | Tragic 13.1% |
| Panamanians | 6.6 /100 | #207 | Tragic 13.1% |
| Ugandans | 6.2 /100 | #208 | Tragic 13.1% |
| Malaysians | 6.1 /100 | #209 | Tragic 13.1% |
| Immigrants | Azores | 6.1 /100 | #210 | Tragic 13.1% |
| Moroccans | 5.2 /100 | #211 | Tragic 13.2% |
| Immigrants | Immigrants | 4.3 /100 | #212 | Tragic 13.2% |
| Immigrants | Panama | 4.1 /100 | #213 | Tragic 13.3% |
| Bermudans | 3.7 /100 | #214 | Tragic 13.3% |
| Japanese | 3.3 /100 | #215 | Tragic 13.3% |
| Immigrants | Nonimmigrants | 3.3 /100 | #216 | Tragic 13.3% |
| Immigrants | Uzbekistan | 3.2 /100 | #217 | Tragic 13.3% |
| Immigrants | Thailand | 3.1 /100 | #218 | Tragic 13.3% |
| Immigrants | Cambodia | 3.0 /100 | #219 | Tragic 13.4% |