Immigrants from Burma/Myanmar vs White/Caucasian Poverty
COMPARE
Immigrants from Burma/Myanmar
White/Caucasian
Poverty
Poverty Comparison
Immigrants from Burma/Myanmar
Whites/Caucasians
14.2%
POVERTY
0.2/ 100
METRIC RATING
251st/ 347
METRIC RANK
12.3%
POVERTY
55.4/ 100
METRIC RATING
169th/ 347
METRIC RANK
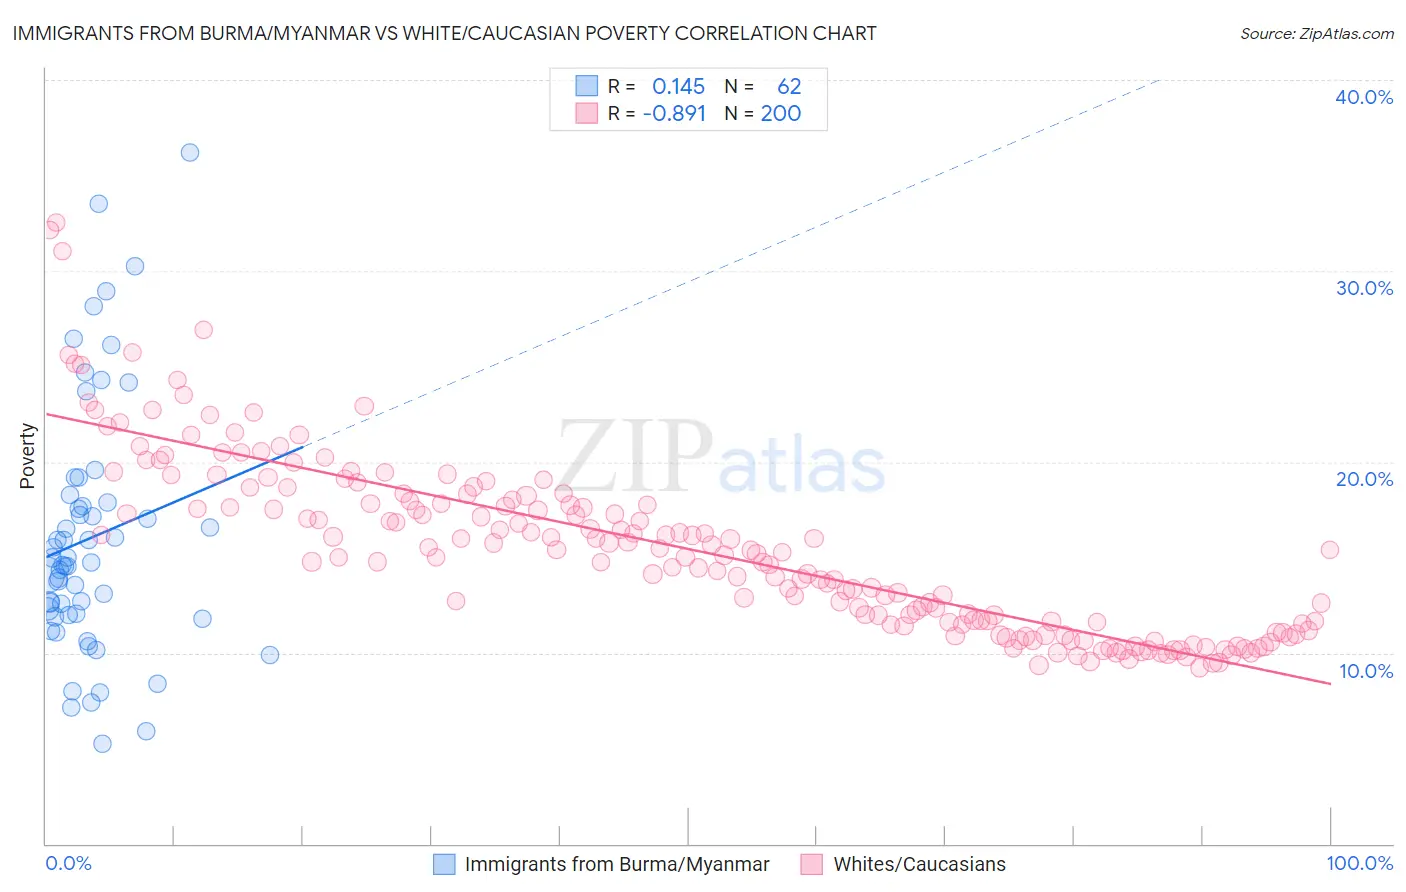
Immigrants from Burma/Myanmar vs White/Caucasian Poverty Correlation Chart
The statistical analysis conducted on geographies consisting of 172,278,151 people shows a poor positive correlation between the proportion of Immigrants from Burma/Myanmar and poverty level in the United States with a correlation coefficient (R) of 0.145 and weighted average of 14.2%. Similarly, the statistical analysis conducted on geographies consisting of 583,792,023 people shows a very strong negative correlation between the proportion of Whites/Caucasians and poverty level in the United States with a correlation coefficient (R) of -0.891 and weighted average of 12.3%, a difference of 16.0%.
Poverty Correlation Summary
| Measurement | Immigrants from Burma/Myanmar | White/Caucasian |
| Minimum | 5.2% | 9.2% |
| Maximum | 36.2% | 32.6% |
| Range | 31.0% | 23.3% |
| Mean | 16.0% | 15.4% |
| Median | 14.7% | 15.2% |
| Interquartile 25% (IQ1) | 12.0% | 11.5% |
| Interquartile 75% (IQ3) | 17.9% | 18.0% |
| Interquartile Range (IQR) | 5.9% | 6.5% |
| Standard Deviation (Sample) | 6.6% | 4.6% |
| Standard Deviation (Population) | 6.6% | 4.6% |
Similar Demographics by Poverty
Demographics Similar to Immigrants from Burma/Myanmar by Poverty
In terms of poverty, the demographic groups most similar to Immigrants from Burma/Myanmar are Cree (14.2%, a difference of 0.090%), Spanish American Indian (14.2%, a difference of 0.11%), Immigrants from Trinidad and Tobago (14.2%, a difference of 0.22%), Immigrants from Ghana (14.2%, a difference of 0.39%), and Immigrants from El Salvador (14.3%, a difference of 0.47%).
| Demographics | Rating | Rank | Poverty |
| Nepalese | 0.3 /100 | #244 | Tragic 14.0% |
| Immigrants | Sudan | 0.3 /100 | #245 | Tragic 14.1% |
| Potawatomi | 0.3 /100 | #246 | Tragic 14.1% |
| Liberians | 0.2 /100 | #247 | Tragic 14.1% |
| Immigrants | Western Africa | 0.2 /100 | #248 | Tragic 14.1% |
| Immigrants | Ghana | 0.2 /100 | #249 | Tragic 14.2% |
| Cree | 0.2 /100 | #250 | Tragic 14.2% |
| Immigrants | Burma/Myanmar | 0.2 /100 | #251 | Tragic 14.2% |
| Spanish American Indians | 0.2 /100 | #252 | Tragic 14.2% |
| Immigrants | Trinidad and Tobago | 0.2 /100 | #253 | Tragic 14.2% |
| Immigrants | El Salvador | 0.1 /100 | #254 | Tragic 14.3% |
| Immigrants | Ecuador | 0.1 /100 | #255 | Tragic 14.3% |
| Mexican American Indians | 0.1 /100 | #256 | Tragic 14.3% |
| Trinidadians and Tobagonians | 0.1 /100 | #257 | Tragic 14.3% |
| Ottawa | 0.1 /100 | #258 | Tragic 14.3% |
Demographics Similar to Whites/Caucasians by Poverty
In terms of poverty, the demographic groups most similar to Whites/Caucasians are Immigrants from Oceania (12.3%, a difference of 0.080%), Immigrants from Venezuela (12.2%, a difference of 0.11%), Immigrants from Chile (12.2%, a difference of 0.13%), Venezuelan (12.2%, a difference of 0.15%), and Immigrants from Albania (12.2%, a difference of 0.23%).
| Demographics | Rating | Rank | Poverty |
| Ethiopians | 59.1 /100 | #162 | Average 12.2% |
| Immigrants | Ethiopia | 58.6 /100 | #163 | Average 12.2% |
| Colombians | 57.8 /100 | #164 | Average 12.2% |
| Immigrants | Albania | 57.7 /100 | #165 | Average 12.2% |
| Venezuelans | 56.9 /100 | #166 | Average 12.2% |
| Immigrants | Chile | 56.7 /100 | #167 | Average 12.2% |
| Immigrants | Venezuela | 56.5 /100 | #168 | Average 12.2% |
| Whites/Caucasians | 55.4 /100 | #169 | Average 12.3% |
| Immigrants | Oceania | 54.6 /100 | #170 | Average 12.3% |
| Immigrants | Spain | 51.3 /100 | #171 | Average 12.3% |
| Immigrants | Portugal | 50.5 /100 | #172 | Average 12.3% |
| Celtics | 50.1 /100 | #173 | Average 12.3% |
| Lebanese | 50.0 /100 | #174 | Average 12.3% |
| South Americans | 48.7 /100 | #175 | Average 12.3% |
| Immigrants | Colombia | 47.7 /100 | #176 | Average 12.3% |