Immigrants from Burma/Myanmar vs Immigrants from Switzerland Poverty
COMPARE
Immigrants from Burma/Myanmar
Immigrants from Switzerland
Poverty
Poverty Comparison
Immigrants from Burma/Myanmar
Immigrants from Switzerland
14.2%
POVERTY
0.2/ 100
METRIC RATING
251st/ 347
METRIC RANK
11.8%
POVERTY
83.0/ 100
METRIC RATING
137th/ 347
METRIC RANK
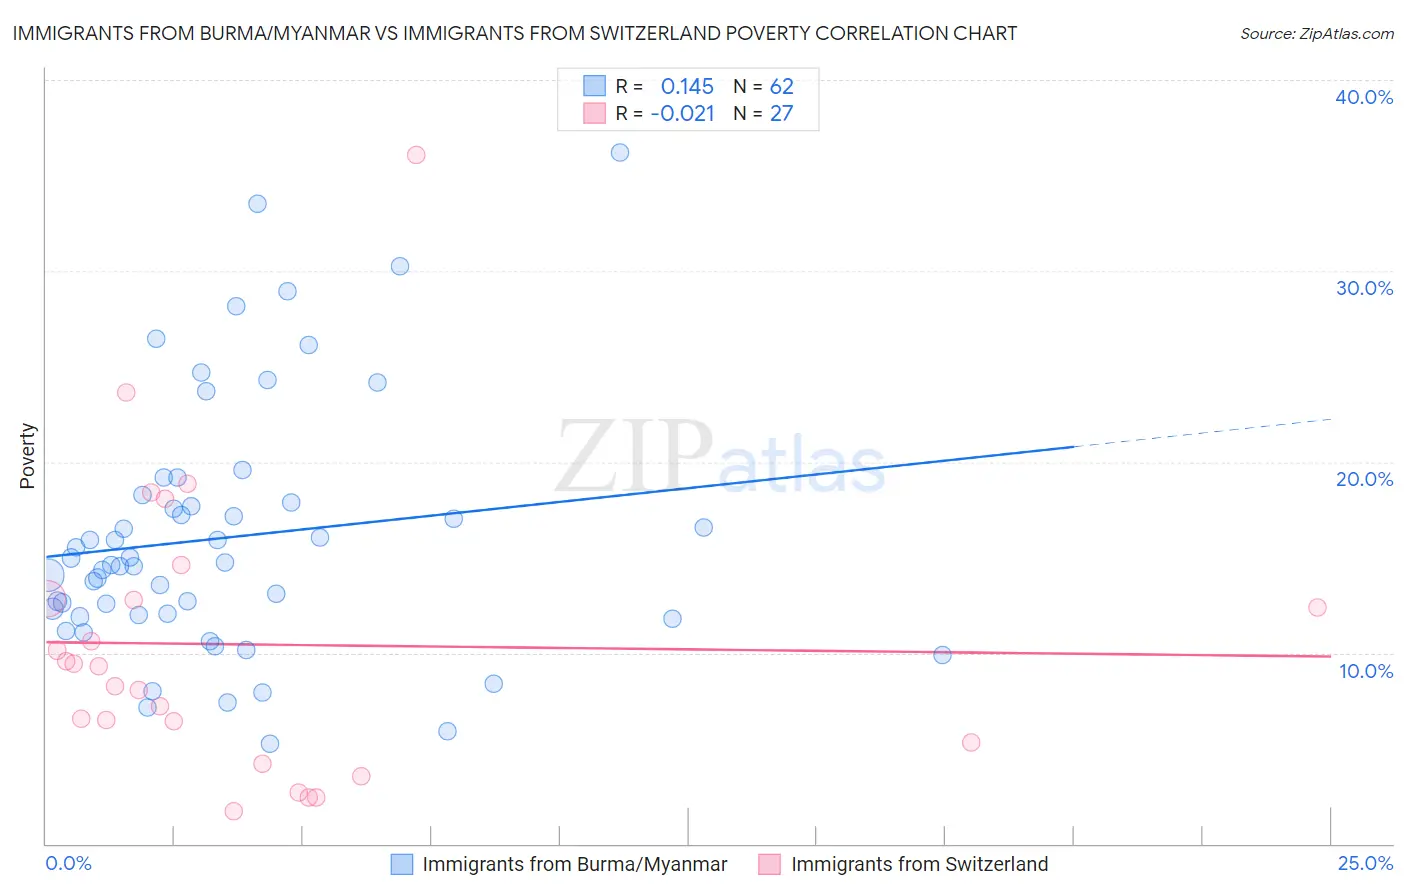
Immigrants from Burma/Myanmar vs Immigrants from Switzerland Poverty Correlation Chart
The statistical analysis conducted on geographies consisting of 172,278,151 people shows a poor positive correlation between the proportion of Immigrants from Burma/Myanmar and poverty level in the United States with a correlation coefficient (R) of 0.145 and weighted average of 14.2%. Similarly, the statistical analysis conducted on geographies consisting of 148,064,410 people shows no correlation between the proportion of Immigrants from Switzerland and poverty level in the United States with a correlation coefficient (R) of -0.021 and weighted average of 11.8%, a difference of 20.0%.
Poverty Correlation Summary
| Measurement | Immigrants from Burma/Myanmar | Immigrants from Switzerland |
| Minimum | 5.2% | 1.7% |
| Maximum | 36.2% | 36.1% |
| Range | 31.0% | 34.3% |
| Mean | 16.0% | 10.4% |
| Median | 14.7% | 9.3% |
| Interquartile 25% (IQ1) | 12.0% | 5.3% |
| Interquartile 75% (IQ3) | 17.9% | 12.8% |
| Interquartile Range (IQR) | 5.9% | 7.6% |
| Standard Deviation (Sample) | 6.6% | 7.6% |
| Standard Deviation (Population) | 6.6% | 7.5% |
Similar Demographics by Poverty
Demographics Similar to Immigrants from Burma/Myanmar by Poverty
In terms of poverty, the demographic groups most similar to Immigrants from Burma/Myanmar are Cree (14.2%, a difference of 0.090%), Spanish American Indian (14.2%, a difference of 0.11%), Immigrants from Trinidad and Tobago (14.2%, a difference of 0.22%), Immigrants from Ghana (14.2%, a difference of 0.39%), and Immigrants from El Salvador (14.3%, a difference of 0.47%).
| Demographics | Rating | Rank | Poverty |
| Nepalese | 0.3 /100 | #244 | Tragic 14.0% |
| Immigrants | Sudan | 0.3 /100 | #245 | Tragic 14.1% |
| Potawatomi | 0.3 /100 | #246 | Tragic 14.1% |
| Liberians | 0.2 /100 | #247 | Tragic 14.1% |
| Immigrants | Western Africa | 0.2 /100 | #248 | Tragic 14.1% |
| Immigrants | Ghana | 0.2 /100 | #249 | Tragic 14.2% |
| Cree | 0.2 /100 | #250 | Tragic 14.2% |
| Immigrants | Burma/Myanmar | 0.2 /100 | #251 | Tragic 14.2% |
| Spanish American Indians | 0.2 /100 | #252 | Tragic 14.2% |
| Immigrants | Trinidad and Tobago | 0.2 /100 | #253 | Tragic 14.2% |
| Immigrants | El Salvador | 0.1 /100 | #254 | Tragic 14.3% |
| Immigrants | Ecuador | 0.1 /100 | #255 | Tragic 14.3% |
| Mexican American Indians | 0.1 /100 | #256 | Tragic 14.3% |
| Trinidadians and Tobagonians | 0.1 /100 | #257 | Tragic 14.3% |
| Ottawa | 0.1 /100 | #258 | Tragic 14.3% |
Demographics Similar to Immigrants from Switzerland by Poverty
In terms of poverty, the demographic groups most similar to Immigrants from Switzerland are Immigrants from Jordan (11.9%, a difference of 0.11%), Pakistani (11.9%, a difference of 0.14%), Chilean (11.8%, a difference of 0.21%), Immigrants from Peru (11.9%, a difference of 0.33%), and Immigrants from Vietnam (11.8%, a difference of 0.41%).
| Demographics | Rating | Rank | Poverty |
| Immigrants | Ukraine | 86.6 /100 | #130 | Excellent 11.8% |
| French | 86.1 /100 | #131 | Excellent 11.8% |
| Peruvians | 85.6 /100 | #132 | Excellent 11.8% |
| Immigrants | Western Europe | 85.2 /100 | #133 | Excellent 11.8% |
| Yugoslavians | 85.2 /100 | #134 | Excellent 11.8% |
| Immigrants | Vietnam | 85.2 /100 | #135 | Excellent 11.8% |
| Chileans | 84.2 /100 | #136 | Excellent 11.8% |
| Immigrants | Switzerland | 83.0 /100 | #137 | Excellent 11.8% |
| Immigrants | Jordan | 82.4 /100 | #138 | Excellent 11.9% |
| Pakistanis | 82.2 /100 | #139 | Excellent 11.9% |
| Immigrants | Peru | 81.1 /100 | #140 | Excellent 11.9% |
| Immigrants | France | 80.5 /100 | #141 | Excellent 11.9% |
| Basques | 80.4 /100 | #142 | Excellent 11.9% |
| Brazilians | 79.7 /100 | #143 | Good 11.9% |
| Icelanders | 77.9 /100 | #144 | Good 11.9% |