Immigrants from Burma/Myanmar vs Immigrants from Caribbean Poverty
COMPARE
Immigrants from Burma/Myanmar
Immigrants from Caribbean
Poverty
Poverty Comparison
Immigrants from Burma/Myanmar
Immigrants from Caribbean
14.2%
POVERTY
0.2/ 100
METRIC RATING
251st/ 347
METRIC RANK
15.5%
POVERTY
0.0/ 100
METRIC RATING
303rd/ 347
METRIC RANK
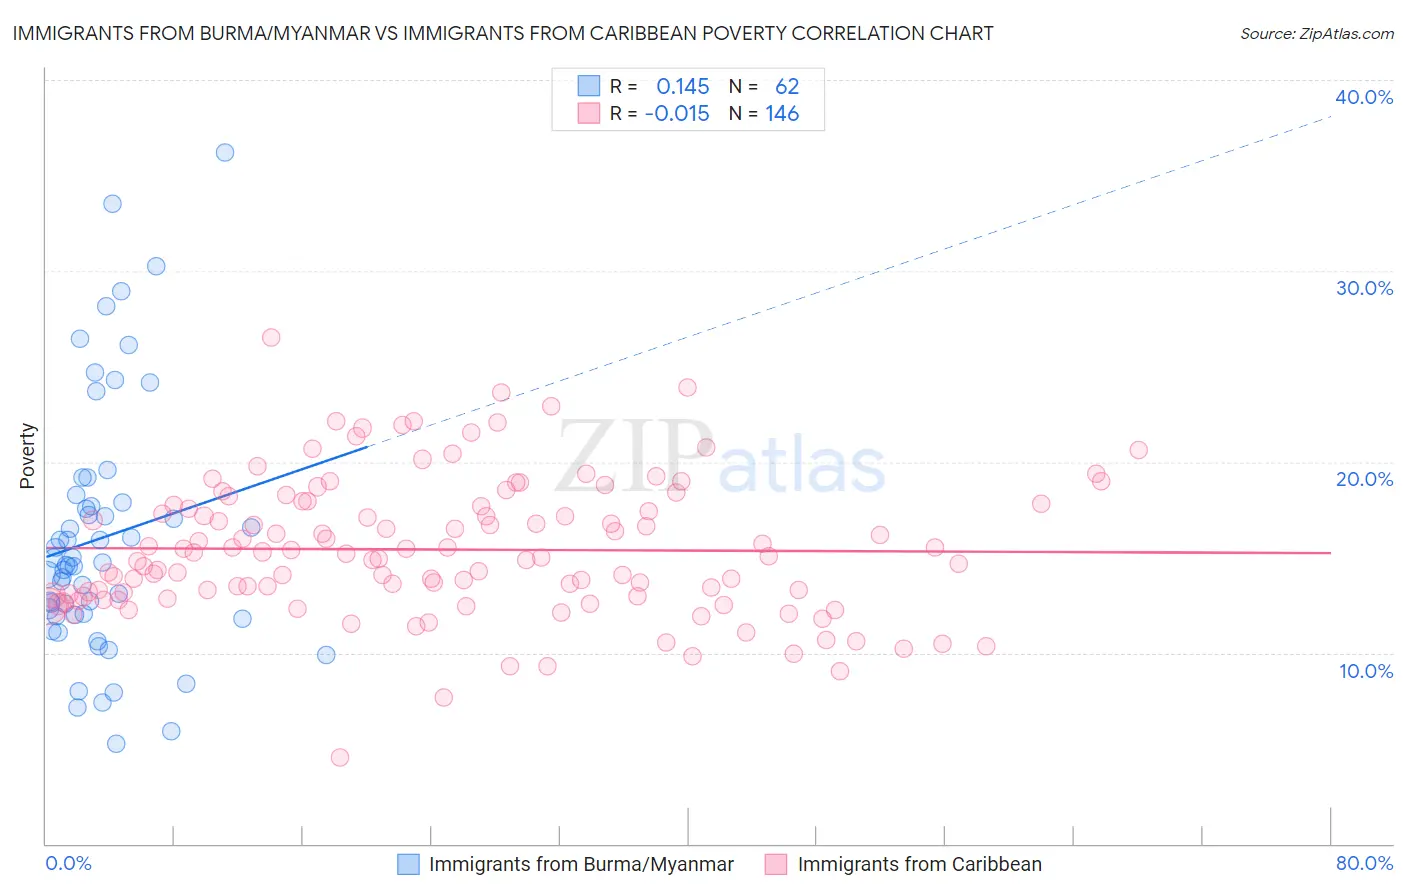
Immigrants from Burma/Myanmar vs Immigrants from Caribbean Poverty Correlation Chart
The statistical analysis conducted on geographies consisting of 172,278,151 people shows a poor positive correlation between the proportion of Immigrants from Burma/Myanmar and poverty level in the United States with a correlation coefficient (R) of 0.145 and weighted average of 14.2%. Similarly, the statistical analysis conducted on geographies consisting of 449,609,031 people shows no correlation between the proportion of Immigrants from Caribbean and poverty level in the United States with a correlation coefficient (R) of -0.015 and weighted average of 15.5%, a difference of 9.0%.
Poverty Correlation Summary
| Measurement | Immigrants from Burma/Myanmar | Immigrants from Caribbean |
| Minimum | 5.2% | 4.5% |
| Maximum | 36.2% | 26.5% |
| Range | 31.0% | 22.0% |
| Mean | 16.0% | 15.4% |
| Median | 14.7% | 15.0% |
| Interquartile 25% (IQ1) | 12.0% | 13.0% |
| Interquartile 75% (IQ3) | 17.9% | 17.7% |
| Interquartile Range (IQR) | 5.9% | 4.8% |
| Standard Deviation (Sample) | 6.6% | 3.6% |
| Standard Deviation (Population) | 6.6% | 3.6% |
Similar Demographics by Poverty
Demographics Similar to Immigrants from Burma/Myanmar by Poverty
In terms of poverty, the demographic groups most similar to Immigrants from Burma/Myanmar are Cree (14.2%, a difference of 0.090%), Spanish American Indian (14.2%, a difference of 0.11%), Immigrants from Trinidad and Tobago (14.2%, a difference of 0.22%), Immigrants from Ghana (14.2%, a difference of 0.39%), and Immigrants from El Salvador (14.3%, a difference of 0.47%).
| Demographics | Rating | Rank | Poverty |
| Nepalese | 0.3 /100 | #244 | Tragic 14.0% |
| Immigrants | Sudan | 0.3 /100 | #245 | Tragic 14.1% |
| Potawatomi | 0.3 /100 | #246 | Tragic 14.1% |
| Liberians | 0.2 /100 | #247 | Tragic 14.1% |
| Immigrants | Western Africa | 0.2 /100 | #248 | Tragic 14.1% |
| Immigrants | Ghana | 0.2 /100 | #249 | Tragic 14.2% |
| Cree | 0.2 /100 | #250 | Tragic 14.2% |
| Immigrants | Burma/Myanmar | 0.2 /100 | #251 | Tragic 14.2% |
| Spanish American Indians | 0.2 /100 | #252 | Tragic 14.2% |
| Immigrants | Trinidad and Tobago | 0.2 /100 | #253 | Tragic 14.2% |
| Immigrants | El Salvador | 0.1 /100 | #254 | Tragic 14.3% |
| Immigrants | Ecuador | 0.1 /100 | #255 | Tragic 14.3% |
| Mexican American Indians | 0.1 /100 | #256 | Tragic 14.3% |
| Trinidadians and Tobagonians | 0.1 /100 | #257 | Tragic 14.3% |
| Ottawa | 0.1 /100 | #258 | Tragic 14.3% |
Demographics Similar to Immigrants from Caribbean by Poverty
In terms of poverty, the demographic groups most similar to Immigrants from Caribbean are Immigrants from Mexico (15.5%, a difference of 0.090%), Immigrants from Guatemala (15.5%, a difference of 0.12%), Somali (15.4%, a difference of 0.48%), Creek (15.6%, a difference of 0.56%), and Bahamian (15.4%, a difference of 0.61%).
| Demographics | Rating | Rank | Poverty |
| Hispanics or Latinos | 0.0 /100 | #296 | Tragic 15.3% |
| Immigrants | Bangladesh | 0.0 /100 | #297 | Tragic 15.3% |
| Immigrants | Senegal | 0.0 /100 | #298 | Tragic 15.3% |
| Senegalese | 0.0 /100 | #299 | Tragic 15.3% |
| Immigrants | Central America | 0.0 /100 | #300 | Tragic 15.4% |
| Bahamians | 0.0 /100 | #301 | Tragic 15.4% |
| Somalis | 0.0 /100 | #302 | Tragic 15.4% |
| Immigrants | Caribbean | 0.0 /100 | #303 | Tragic 15.5% |
| Immigrants | Mexico | 0.0 /100 | #304 | Tragic 15.5% |
| Immigrants | Guatemala | 0.0 /100 | #305 | Tragic 15.5% |
| Creek | 0.0 /100 | #306 | Tragic 15.6% |
| Africans | 0.0 /100 | #307 | Tragic 15.6% |
| Choctaw | 0.0 /100 | #308 | Tragic 15.6% |
| Seminole | 0.0 /100 | #309 | Tragic 15.6% |
| Dutch West Indians | 0.0 /100 | #310 | Tragic 15.6% |