Japanese vs Immigrants from Indonesia Single Female Poverty
COMPARE
Japanese
Immigrants from Indonesia
Single Female Poverty
Single Female Poverty Comparison
Japanese
Immigrants from Indonesia
21.3%
SINGLE FEMALE POVERTY
26.4/ 100
METRIC RATING
197th/ 347
METRIC RANK
18.9%
SINGLE FEMALE POVERTY
99.8/ 100
METRIC RATING
45th/ 347
METRIC RANK
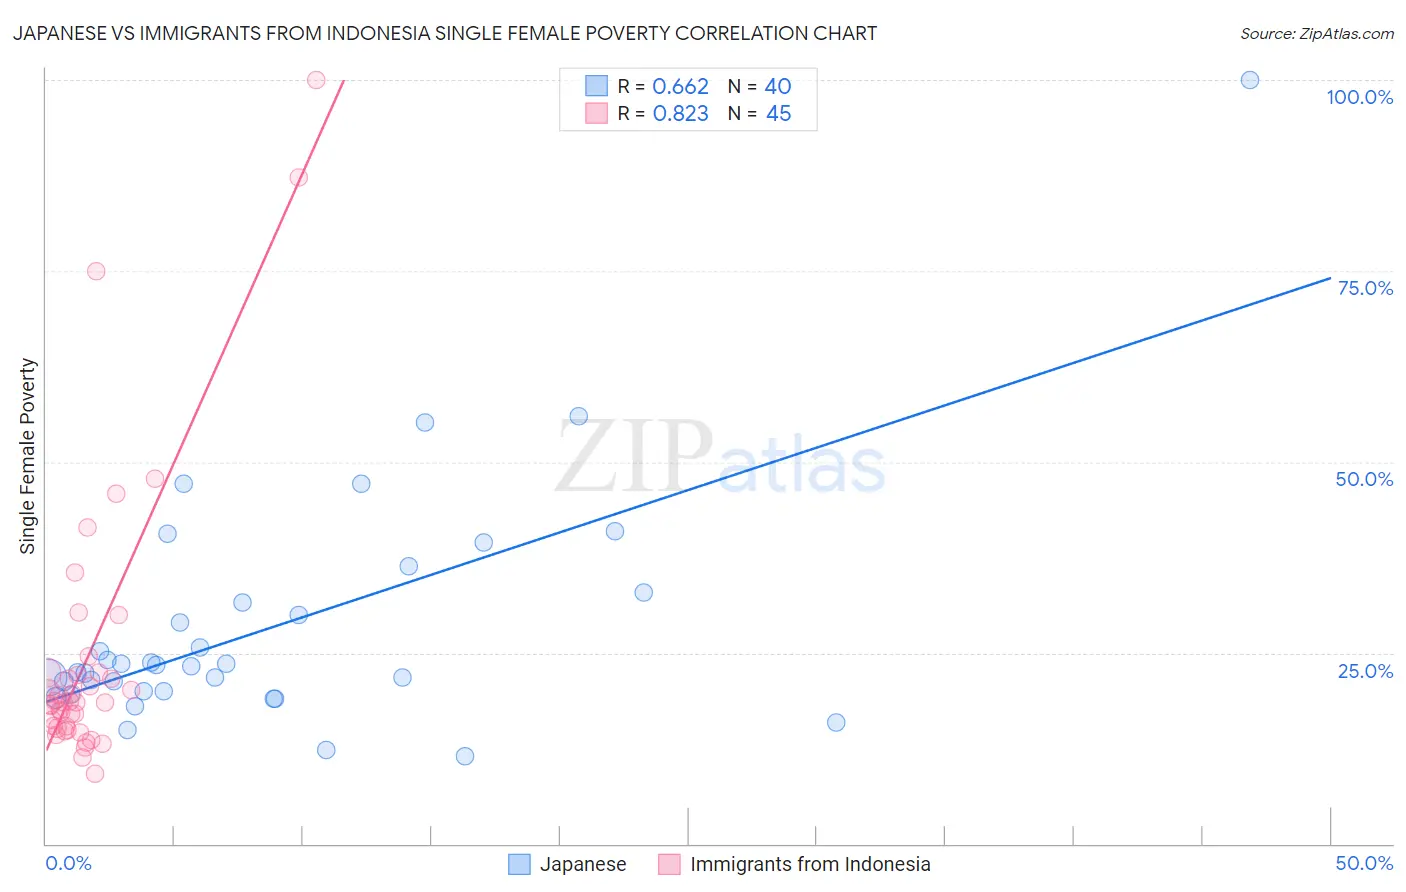
Japanese vs Immigrants from Indonesia Single Female Poverty Correlation Chart
The statistical analysis conducted on geographies consisting of 247,508,626 people shows a significant positive correlation between the proportion of Japanese and poverty level among single females in the United States with a correlation coefficient (R) of 0.662 and weighted average of 21.3%. Similarly, the statistical analysis conducted on geographies consisting of 213,892,292 people shows a very strong positive correlation between the proportion of Immigrants from Indonesia and poverty level among single females in the United States with a correlation coefficient (R) of 0.823 and weighted average of 18.9%, a difference of 12.8%.
Single Female Poverty Correlation Summary
| Measurement | Japanese | Immigrants from Indonesia |
| Minimum | 11.5% | 9.1% |
| Maximum | 100.0% | 100.0% |
| Range | 88.5% | 90.9% |
| Mean | 28.5% | 24.9% |
| Median | 23.4% | 18.5% |
| Interquartile 25% (IQ1) | 19.9% | 15.2% |
| Interquartile 75% (IQ3) | 32.3% | 22.5% |
| Interquartile Range (IQR) | 12.3% | 7.2% |
| Standard Deviation (Sample) | 15.9% | 19.0% |
| Standard Deviation (Population) | 15.7% | 18.8% |
Similar Demographics by Single Female Poverty
Demographics Similar to Japanese by Single Female Poverty
In terms of single female poverty, the demographic groups most similar to Japanese are Immigrants from Saudi Arabia (21.3%, a difference of 0.060%), Nicaraguan (21.3%, a difference of 0.090%), Czechoslovakian (21.3%, a difference of 0.10%), Basque (21.3%, a difference of 0.13%), and Swiss (21.4%, a difference of 0.17%).
| Demographics | Rating | Rank | Single Female Poverty |
| Trinidadians and Tobagonians | 35.2 /100 | #190 | Fair 21.2% |
| Immigrants | Germany | 31.1 /100 | #191 | Fair 21.3% |
| Immigrants | Jamaica | 30.5 /100 | #192 | Fair 21.3% |
| Basques | 28.1 /100 | #193 | Fair 21.3% |
| Czechoslovakians | 27.7 /100 | #194 | Fair 21.3% |
| Nicaraguans | 27.6 /100 | #195 | Fair 21.3% |
| Immigrants | Saudi Arabia | 27.1 /100 | #196 | Fair 21.3% |
| Japanese | 26.4 /100 | #197 | Fair 21.3% |
| Swiss | 24.2 /100 | #198 | Fair 21.4% |
| Immigrants | Immigrants | 22.0 /100 | #199 | Fair 21.4% |
| Irish | 21.4 /100 | #200 | Fair 21.4% |
| Nigerians | 20.9 /100 | #201 | Fair 21.4% |
| Immigrants | Kenya | 20.7 /100 | #202 | Fair 21.4% |
| Immigrants | Haiti | 18.8 /100 | #203 | Poor 21.5% |
| Immigrants | Africa | 16.7 /100 | #204 | Poor 21.5% |
Demographics Similar to Immigrants from Indonesia by Single Female Poverty
In terms of single female poverty, the demographic groups most similar to Immigrants from Indonesia are Macedonian (18.9%, a difference of 0.16%), Immigrants from Croatia (18.9%, a difference of 0.21%), Latvian (19.0%, a difference of 0.35%), Immigrants from Romania (18.8%, a difference of 0.38%), and Jordanian (18.8%, a difference of 0.53%).
| Demographics | Rating | Rank | Single Female Poverty |
| Tongans | 99.9 /100 | #38 | Exceptional 18.8% |
| Bulgarians | 99.9 /100 | #39 | Exceptional 18.8% |
| Okinawans | 99.9 /100 | #40 | Exceptional 18.8% |
| Immigrants | Serbia | 99.9 /100 | #41 | Exceptional 18.8% |
| Jordanians | 99.9 /100 | #42 | Exceptional 18.8% |
| Immigrants | Romania | 99.9 /100 | #43 | Exceptional 18.8% |
| Immigrants | Croatia | 99.9 /100 | #44 | Exceptional 18.9% |
| Immigrants | Indonesia | 99.8 /100 | #45 | Exceptional 18.9% |
| Macedonians | 99.8 /100 | #46 | Exceptional 18.9% |
| Latvians | 99.8 /100 | #47 | Exceptional 19.0% |
| Immigrants | Argentina | 99.8 /100 | #48 | Exceptional 19.0% |
| Immigrants | Czechoslovakia | 99.8 /100 | #49 | Exceptional 19.0% |
| Immigrants | Eastern Europe | 99.8 /100 | #50 | Exceptional 19.0% |
| Immigrants | Italy | 99.8 /100 | #51 | Exceptional 19.0% |
| Egyptians | 99.7 /100 | #52 | Exceptional 19.1% |