Immigrants from Bulgaria vs Cherokee Female Poverty
COMPARE
Immigrants from Bulgaria
Cherokee
Female Poverty
Female Poverty Comparison
Immigrants from Bulgaria
Cherokee
12.0%
FEMALE POVERTY
98.9/ 100
METRIC RATING
51st/ 347
METRIC RANK
15.6%
FEMALE POVERTY
0.1/ 100
METRIC RATING
263rd/ 347
METRIC RANK
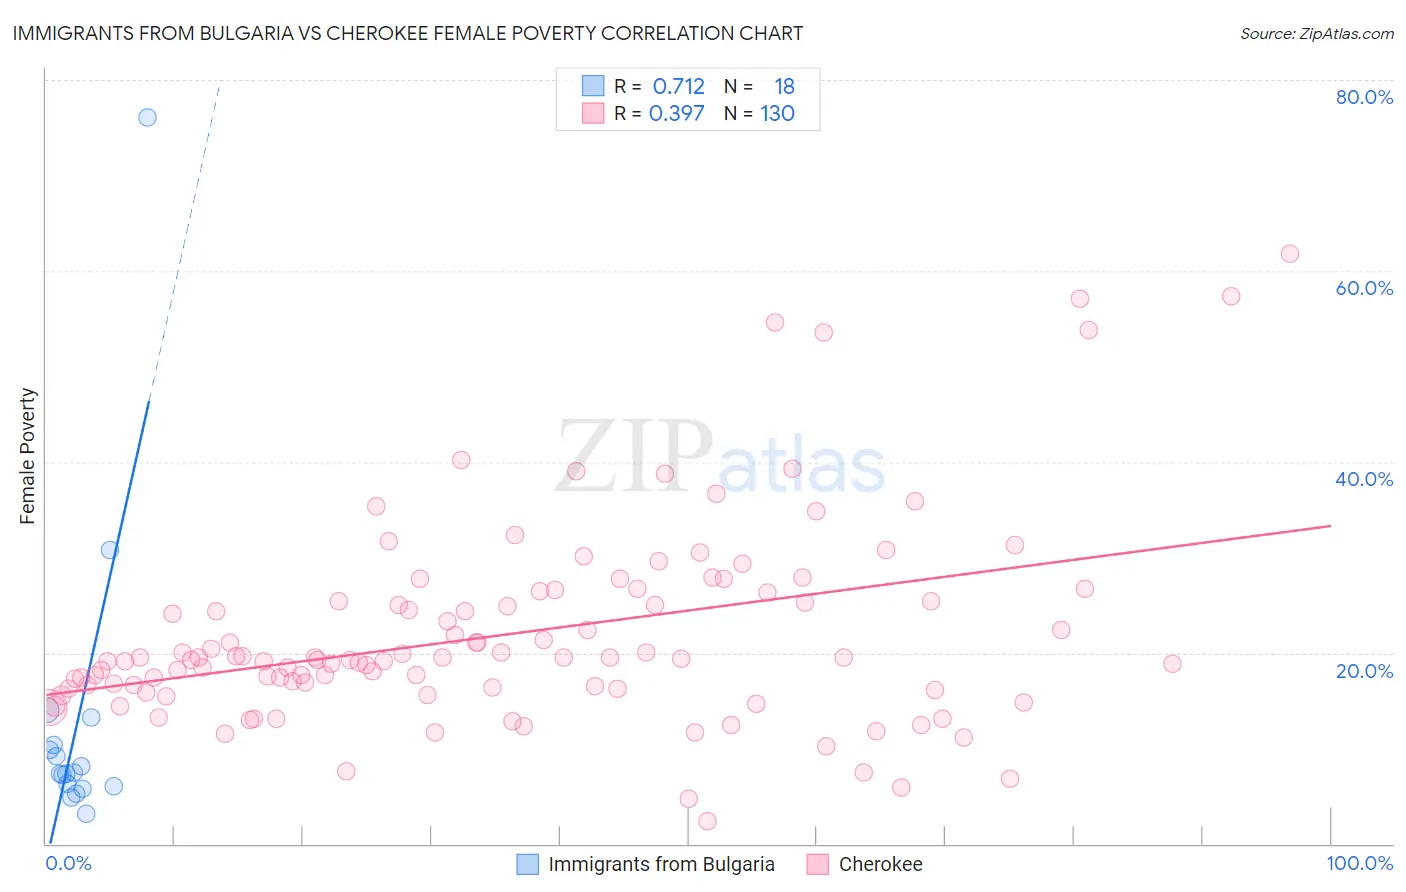
Immigrants from Bulgaria vs Cherokee Female Poverty Correlation Chart
The statistical analysis conducted on geographies consisting of 172,523,298 people shows a strong positive correlation between the proportion of Immigrants from Bulgaria and poverty level among females in the United States with a correlation coefficient (R) of 0.712 and weighted average of 12.0%. Similarly, the statistical analysis conducted on geographies consisting of 493,220,722 people shows a mild positive correlation between the proportion of Cherokee and poverty level among females in the United States with a correlation coefficient (R) of 0.397 and weighted average of 15.6%, a difference of 30.1%.
Female Poverty Correlation Summary
| Measurement | Immigrants from Bulgaria | Cherokee |
| Minimum | 3.1% | 2.3% |
| Maximum | 76.0% | 61.8% |
| Range | 72.9% | 59.5% |
| Mean | 12.9% | 21.9% |
| Median | 7.4% | 19.3% |
| Interquartile 25% (IQ1) | 6.0% | 16.3% |
| Interquartile 75% (IQ3) | 10.3% | 25.5% |
| Interquartile Range (IQR) | 4.3% | 9.2% |
| Standard Deviation (Sample) | 16.9% | 10.5% |
| Standard Deviation (Population) | 16.4% | 10.5% |
Similar Demographics by Female Poverty
Demographics Similar to Immigrants from Bulgaria by Female Poverty
In terms of female poverty, the demographic groups most similar to Immigrants from Bulgaria are Slovene (12.0%, a difference of 0.22%), Immigrants from Romania (12.0%, a difference of 0.23%), Immigrants from Croatia (12.0%, a difference of 0.31%), Immigrants from Austria (12.0%, a difference of 0.31%), and Immigrants from Japan (11.9%, a difference of 0.42%).
| Demographics | Rating | Rank | Female Poverty |
| Tongans | 99.2 /100 | #44 | Exceptional 11.9% |
| Immigrants | Czechoslovakia | 99.2 /100 | #45 | Exceptional 11.9% |
| Turks | 99.2 /100 | #46 | Exceptional 11.9% |
| Asians | 99.1 /100 | #47 | Exceptional 11.9% |
| Immigrants | Japan | 99.0 /100 | #48 | Exceptional 11.9% |
| Immigrants | Romania | 99.0 /100 | #49 | Exceptional 12.0% |
| Slovenes | 98.9 /100 | #50 | Exceptional 12.0% |
| Immigrants | Bulgaria | 98.9 /100 | #51 | Exceptional 12.0% |
| Immigrants | Croatia | 98.7 /100 | #52 | Exceptional 12.0% |
| Immigrants | Austria | 98.7 /100 | #53 | Exceptional 12.0% |
| Immigrants | Philippines | 98.7 /100 | #54 | Exceptional 12.1% |
| Immigrants | Sri Lanka | 98.5 /100 | #55 | Exceptional 12.1% |
| Estonians | 98.3 /100 | #56 | Exceptional 12.1% |
| Immigrants | Serbia | 98.3 /100 | #57 | Exceptional 12.1% |
| Scandinavians | 98.2 /100 | #58 | Exceptional 12.1% |
Demographics Similar to Cherokee by Female Poverty
In terms of female poverty, the demographic groups most similar to Cherokee are Guyanese (15.6%, a difference of 0.010%), Mexican American Indian (15.6%, a difference of 0.010%), Immigrants from Guyana (15.6%, a difference of 0.11%), Immigrants from Ecuador (15.6%, a difference of 0.13%), and Cape Verdean (15.6%, a difference of 0.19%).
| Demographics | Rating | Rank | Female Poverty |
| Jamaicans | 0.2 /100 | #256 | Tragic 15.5% |
| Immigrants | Jamaica | 0.1 /100 | #257 | Tragic 15.6% |
| Shoshone | 0.1 /100 | #258 | Tragic 15.6% |
| Cape Verdeans | 0.1 /100 | #259 | Tragic 15.6% |
| Immigrants | Guyana | 0.1 /100 | #260 | Tragic 15.6% |
| Guyanese | 0.1 /100 | #261 | Tragic 15.6% |
| Mexican American Indians | 0.1 /100 | #262 | Tragic 15.6% |
| Cherokee | 0.1 /100 | #263 | Tragic 15.6% |
| Immigrants | Ecuador | 0.1 /100 | #264 | Tragic 15.6% |
| Immigrants | Liberia | 0.1 /100 | #265 | Tragic 15.7% |
| Immigrants | El Salvador | 0.1 /100 | #266 | Tragic 15.7% |
| Sub-Saharan Africans | 0.1 /100 | #267 | Tragic 15.8% |
| Immigrants | Nicaragua | 0.1 /100 | #268 | Tragic 15.8% |
| Iroquois | 0.1 /100 | #269 | Tragic 15.8% |
| Chickasaw | 0.1 /100 | #270 | Tragic 15.9% |