Okinawan vs Cherokee Female Poverty
COMPARE
Okinawan
Cherokee
Female Poverty
Female Poverty Comparison
Okinawans
Cherokee
12.4%
FEMALE POVERTY
96.4/ 100
METRIC RATING
87th/ 347
METRIC RANK
15.6%
FEMALE POVERTY
0.1/ 100
METRIC RATING
263rd/ 347
METRIC RANK
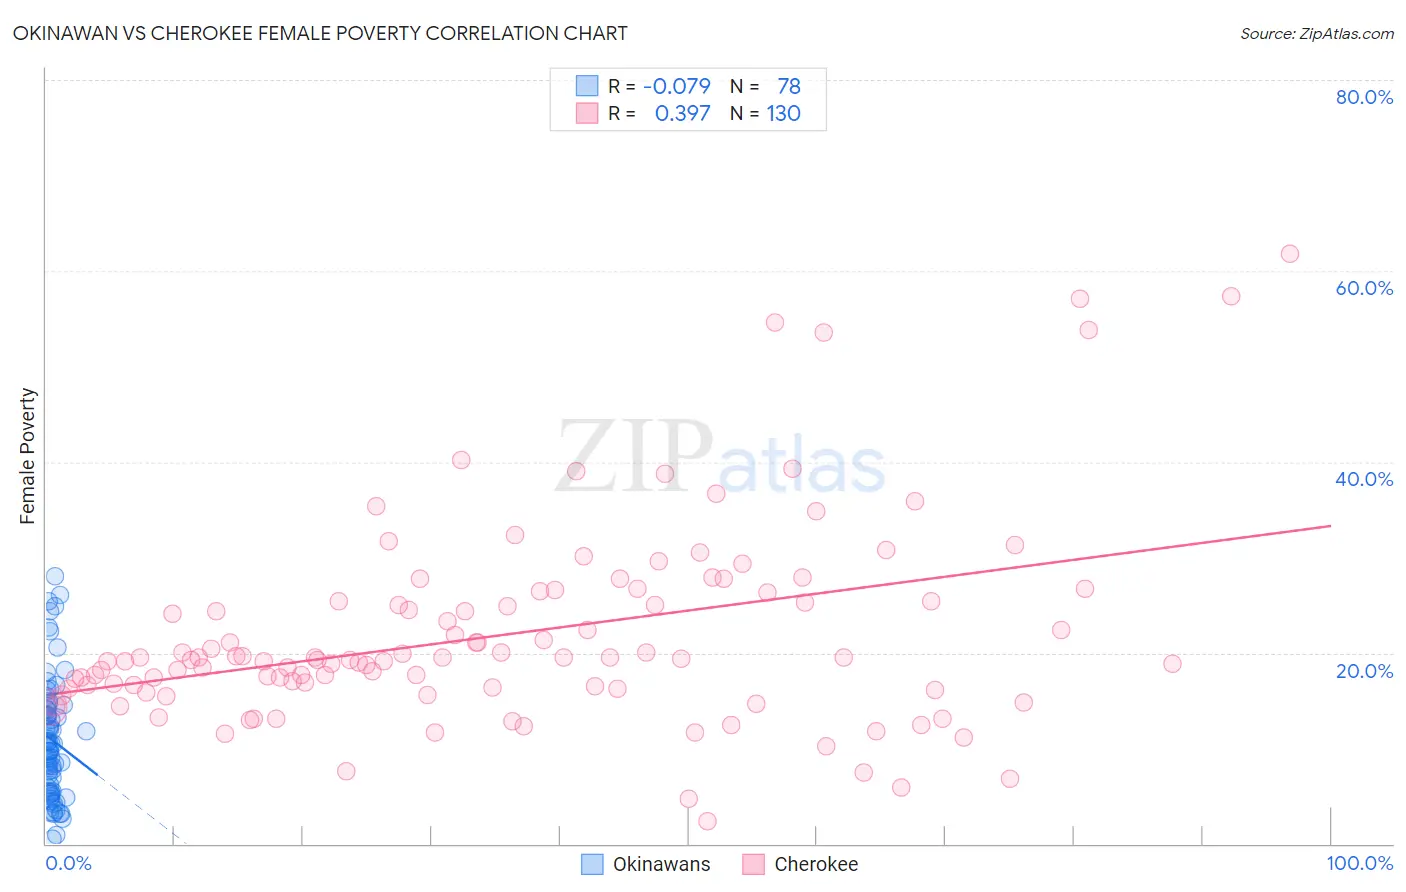
Okinawan vs Cherokee Female Poverty Correlation Chart
The statistical analysis conducted on geographies consisting of 73,724,084 people shows a slight negative correlation between the proportion of Okinawans and poverty level among females in the United States with a correlation coefficient (R) of -0.079 and weighted average of 12.4%. Similarly, the statistical analysis conducted on geographies consisting of 493,220,722 people shows a mild positive correlation between the proportion of Cherokee and poverty level among females in the United States with a correlation coefficient (R) of 0.397 and weighted average of 15.6%, a difference of 26.2%.
Female Poverty Correlation Summary
| Measurement | Okinawan | Cherokee |
| Minimum | 0.59% | 2.3% |
| Maximum | 28.0% | 61.8% |
| Range | 27.4% | 59.5% |
| Mean | 10.9% | 21.9% |
| Median | 10.1% | 19.3% |
| Interquartile 25% (IQ1) | 5.5% | 16.3% |
| Interquartile 75% (IQ3) | 14.2% | 25.5% |
| Interquartile Range (IQR) | 8.7% | 9.2% |
| Standard Deviation (Sample) | 6.3% | 10.5% |
| Standard Deviation (Population) | 6.2% | 10.5% |
Similar Demographics by Female Poverty
Demographics Similar to Okinawans by Female Poverty
In terms of female poverty, the demographic groups most similar to Okinawans are Dutch (12.4%, a difference of 0.020%), Irish (12.4%, a difference of 0.050%), Finnish (12.4%, a difference of 0.050%), Northern European (12.4%, a difference of 0.10%), and English (12.4%, a difference of 0.24%).
| Demographics | Rating | Rank | Female Poverty |
| Slovaks | 97.1 /100 | #80 | Exceptional 12.3% |
| Immigrants | Sweden | 97.1 /100 | #81 | Exceptional 12.3% |
| Jordanians | 97.1 /100 | #82 | Exceptional 12.3% |
| Immigrants | England | 96.9 /100 | #83 | Exceptional 12.3% |
| Northern Europeans | 96.6 /100 | #84 | Exceptional 12.4% |
| Irish | 96.5 /100 | #85 | Exceptional 12.4% |
| Dutch | 96.5 /100 | #86 | Exceptional 12.4% |
| Okinawans | 96.4 /100 | #87 | Exceptional 12.4% |
| Finns | 96.4 /100 | #88 | Exceptional 12.4% |
| English | 96.1 /100 | #89 | Exceptional 12.4% |
| Immigrants | Denmark | 95.8 /100 | #90 | Exceptional 12.4% |
| Belgians | 95.8 /100 | #91 | Exceptional 12.4% |
| Czechoslovakians | 95.7 /100 | #92 | Exceptional 12.4% |
| Immigrants | Egypt | 95.5 /100 | #93 | Exceptional 12.5% |
| Immigrants | Indonesia | 95.4 /100 | #94 | Exceptional 12.5% |
Demographics Similar to Cherokee by Female Poverty
In terms of female poverty, the demographic groups most similar to Cherokee are Guyanese (15.6%, a difference of 0.010%), Mexican American Indian (15.6%, a difference of 0.010%), Immigrants from Guyana (15.6%, a difference of 0.11%), Immigrants from Ecuador (15.6%, a difference of 0.13%), and Cape Verdean (15.6%, a difference of 0.19%).
| Demographics | Rating | Rank | Female Poverty |
| Jamaicans | 0.2 /100 | #256 | Tragic 15.5% |
| Immigrants | Jamaica | 0.1 /100 | #257 | Tragic 15.6% |
| Shoshone | 0.1 /100 | #258 | Tragic 15.6% |
| Cape Verdeans | 0.1 /100 | #259 | Tragic 15.6% |
| Immigrants | Guyana | 0.1 /100 | #260 | Tragic 15.6% |
| Guyanese | 0.1 /100 | #261 | Tragic 15.6% |
| Mexican American Indians | 0.1 /100 | #262 | Tragic 15.6% |
| Cherokee | 0.1 /100 | #263 | Tragic 15.6% |
| Immigrants | Ecuador | 0.1 /100 | #264 | Tragic 15.6% |
| Immigrants | Liberia | 0.1 /100 | #265 | Tragic 15.7% |
| Immigrants | El Salvador | 0.1 /100 | #266 | Tragic 15.7% |
| Sub-Saharan Africans | 0.1 /100 | #267 | Tragic 15.8% |
| Immigrants | Nicaragua | 0.1 /100 | #268 | Tragic 15.8% |
| Iroquois | 0.1 /100 | #269 | Tragic 15.8% |
| Chickasaw | 0.1 /100 | #270 | Tragic 15.9% |