Immigrants from Bulgaria vs Hawaiian Female Poverty
COMPARE
Immigrants from Bulgaria
Hawaiian
Female Poverty
Female Poverty Comparison
Immigrants from Bulgaria
Hawaiians
12.0%
FEMALE POVERTY
98.9/ 100
METRIC RATING
51st/ 347
METRIC RANK
13.6%
FEMALE POVERTY
39.9/ 100
METRIC RATING
188th/ 347
METRIC RANK
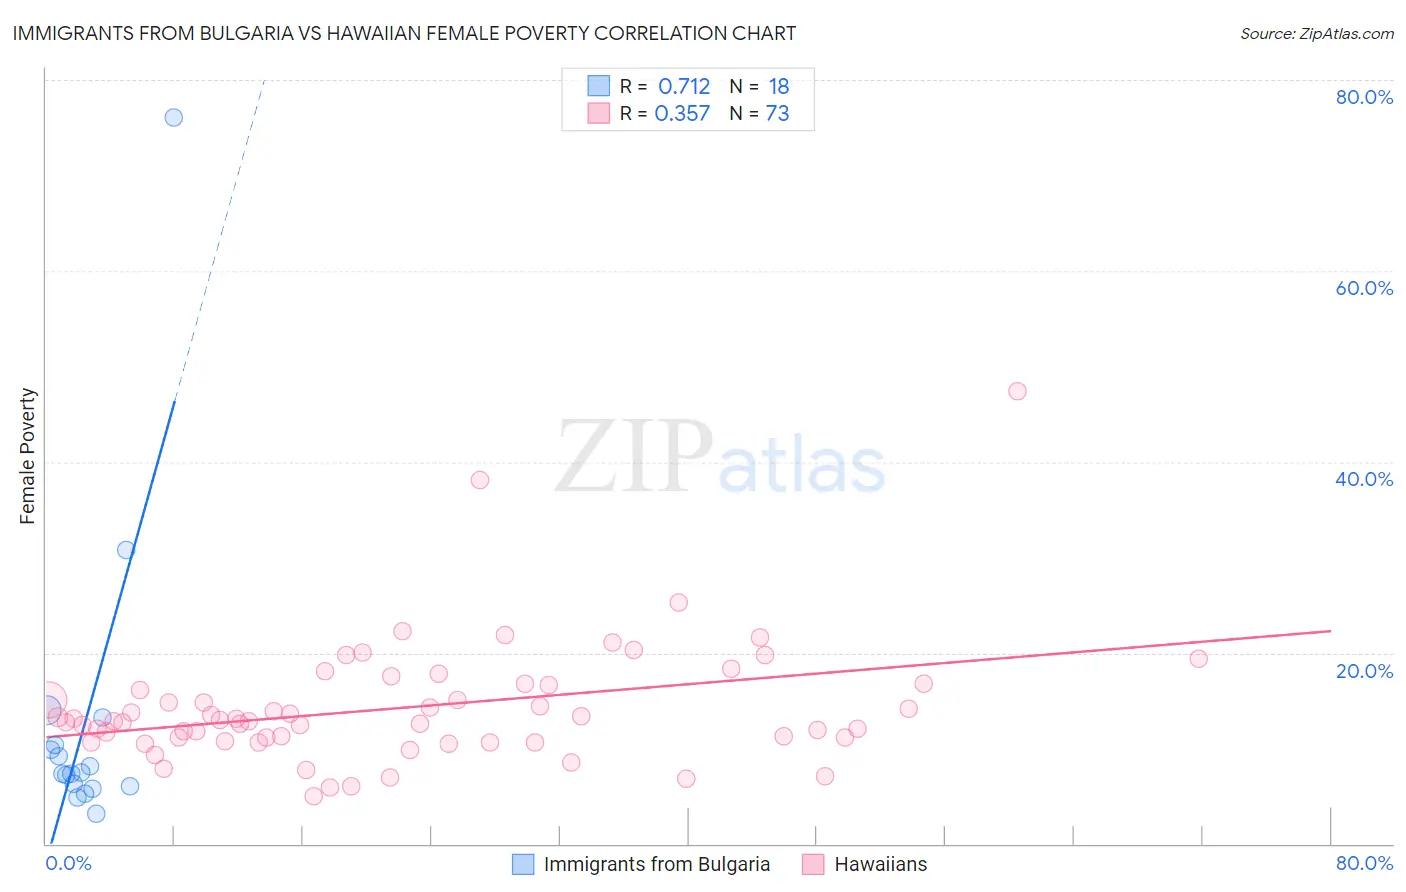
Immigrants from Bulgaria vs Hawaiian Female Poverty Correlation Chart
The statistical analysis conducted on geographies consisting of 172,523,298 people shows a strong positive correlation between the proportion of Immigrants from Bulgaria and poverty level among females in the United States with a correlation coefficient (R) of 0.712 and weighted average of 12.0%. Similarly, the statistical analysis conducted on geographies consisting of 327,347,433 people shows a mild positive correlation between the proportion of Hawaiians and poverty level among females in the United States with a correlation coefficient (R) of 0.357 and weighted average of 13.6%, a difference of 13.1%.
Female Poverty Correlation Summary
| Measurement | Immigrants from Bulgaria | Hawaiian |
| Minimum | 3.1% | 5.0% |
| Maximum | 76.0% | 47.5% |
| Range | 72.9% | 42.5% |
| Mean | 12.9% | 14.3% |
| Median | 7.4% | 12.9% |
| Interquartile 25% (IQ1) | 6.0% | 11.0% |
| Interquartile 75% (IQ3) | 10.3% | 16.6% |
| Interquartile Range (IQR) | 4.3% | 5.7% |
| Standard Deviation (Sample) | 16.9% | 6.5% |
| Standard Deviation (Population) | 16.4% | 6.4% |
Similar Demographics by Female Poverty
Demographics Similar to Immigrants from Bulgaria by Female Poverty
In terms of female poverty, the demographic groups most similar to Immigrants from Bulgaria are Slovene (12.0%, a difference of 0.22%), Immigrants from Romania (12.0%, a difference of 0.23%), Immigrants from Croatia (12.0%, a difference of 0.31%), Immigrants from Austria (12.0%, a difference of 0.31%), and Immigrants from Japan (11.9%, a difference of 0.42%).
| Demographics | Rating | Rank | Female Poverty |
| Tongans | 99.2 /100 | #44 | Exceptional 11.9% |
| Immigrants | Czechoslovakia | 99.2 /100 | #45 | Exceptional 11.9% |
| Turks | 99.2 /100 | #46 | Exceptional 11.9% |
| Asians | 99.1 /100 | #47 | Exceptional 11.9% |
| Immigrants | Japan | 99.0 /100 | #48 | Exceptional 11.9% |
| Immigrants | Romania | 99.0 /100 | #49 | Exceptional 12.0% |
| Slovenes | 98.9 /100 | #50 | Exceptional 12.0% |
| Immigrants | Bulgaria | 98.9 /100 | #51 | Exceptional 12.0% |
| Immigrants | Croatia | 98.7 /100 | #52 | Exceptional 12.0% |
| Immigrants | Austria | 98.7 /100 | #53 | Exceptional 12.0% |
| Immigrants | Philippines | 98.7 /100 | #54 | Exceptional 12.1% |
| Immigrants | Sri Lanka | 98.5 /100 | #55 | Exceptional 12.1% |
| Estonians | 98.3 /100 | #56 | Exceptional 12.1% |
| Immigrants | Serbia | 98.3 /100 | #57 | Exceptional 12.1% |
| Scandinavians | 98.2 /100 | #58 | Exceptional 12.1% |
Demographics Similar to Hawaiians by Female Poverty
In terms of female poverty, the demographic groups most similar to Hawaiians are Uruguayan (13.6%, a difference of 0.010%), Immigrants from Venezuela (13.6%, a difference of 0.11%), Immigrants from Portugal (13.6%, a difference of 0.16%), Immigrants from Cameroon (13.5%, a difference of 0.21%), and Immigrants from Sierra Leone (13.5%, a difference of 0.32%).
| Demographics | Rating | Rank | Female Poverty |
| Venezuelans | 44.5 /100 | #181 | Average 13.5% |
| Immigrants | Colombia | 44.5 /100 | #182 | Average 13.5% |
| Kenyans | 43.8 /100 | #183 | Average 13.5% |
| Immigrants | Sierra Leone | 43.2 /100 | #184 | Average 13.5% |
| Immigrants | Cameroon | 42.0 /100 | #185 | Average 13.5% |
| Immigrants | Portugal | 41.5 /100 | #186 | Average 13.6% |
| Immigrants | Venezuela | 41.0 /100 | #187 | Average 13.6% |
| Hawaiians | 39.9 /100 | #188 | Fair 13.6% |
| Uruguayans | 39.8 /100 | #189 | Fair 13.6% |
| Sierra Leoneans | 33.1 /100 | #190 | Fair 13.7% |
| Immigrants | Kuwait | 32.7 /100 | #191 | Fair 13.7% |
| Immigrants | Costa Rica | 31.9 /100 | #192 | Fair 13.7% |
| Iraqis | 31.8 /100 | #193 | Fair 13.7% |
| Delaware | 31.1 /100 | #194 | Fair 13.7% |
| Immigrants | South America | 30.6 /100 | #195 | Fair 13.7% |