Immigrants from Bulgaria vs British West Indian Female Poverty
COMPARE
Immigrants from Bulgaria
British West Indian
Female Poverty
Female Poverty Comparison
Immigrants from Bulgaria
British West Indians
12.0%
FEMALE POVERTY
98.9/ 100
METRIC RATING
51st/ 347
METRIC RANK
17.0%
FEMALE POVERTY
0.0/ 100
METRIC RATING
313th/ 347
METRIC RANK
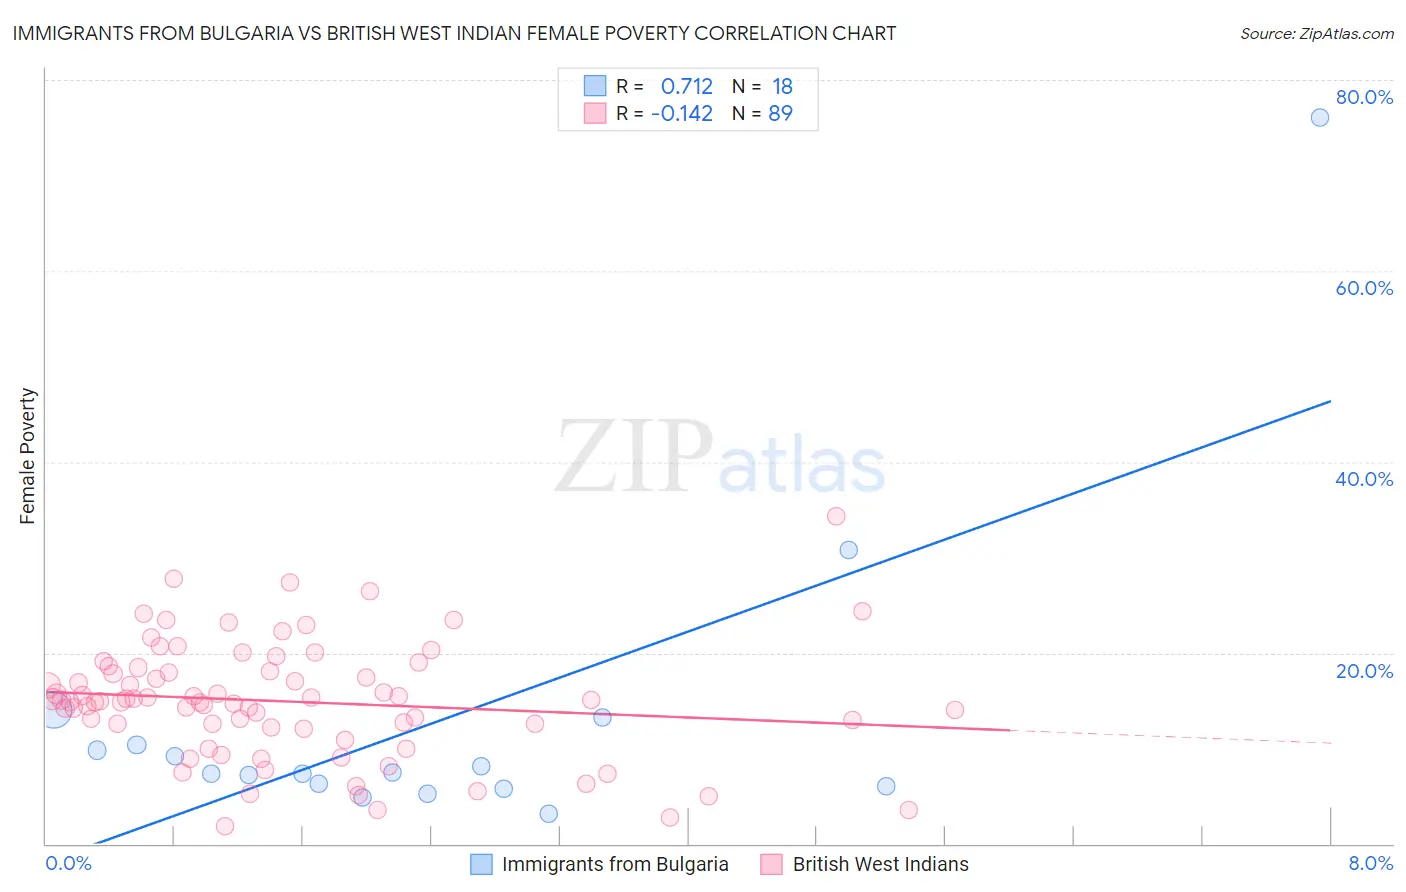
Immigrants from Bulgaria vs British West Indian Female Poverty Correlation Chart
The statistical analysis conducted on geographies consisting of 172,523,298 people shows a strong positive correlation between the proportion of Immigrants from Bulgaria and poverty level among females in the United States with a correlation coefficient (R) of 0.712 and weighted average of 12.0%. Similarly, the statistical analysis conducted on geographies consisting of 152,611,621 people shows a poor negative correlation between the proportion of British West Indians and poverty level among females in the United States with a correlation coefficient (R) of -0.142 and weighted average of 17.0%, a difference of 42.0%.
Female Poverty Correlation Summary
| Measurement | Immigrants from Bulgaria | British West Indian |
| Minimum | 3.1% | 1.8% |
| Maximum | 76.0% | 34.4% |
| Range | 72.9% | 32.6% |
| Mean | 12.9% | 14.9% |
| Median | 7.4% | 15.0% |
| Interquartile 25% (IQ1) | 6.0% | 12.1% |
| Interquartile 75% (IQ3) | 10.3% | 18.3% |
| Interquartile Range (IQR) | 4.3% | 6.2% |
| Standard Deviation (Sample) | 16.9% | 6.1% |
| Standard Deviation (Population) | 16.4% | 6.0% |
Similar Demographics by Female Poverty
Demographics Similar to Immigrants from Bulgaria by Female Poverty
In terms of female poverty, the demographic groups most similar to Immigrants from Bulgaria are Slovene (12.0%, a difference of 0.22%), Immigrants from Romania (12.0%, a difference of 0.23%), Immigrants from Croatia (12.0%, a difference of 0.31%), Immigrants from Austria (12.0%, a difference of 0.31%), and Immigrants from Japan (11.9%, a difference of 0.42%).
| Demographics | Rating | Rank | Female Poverty |
| Tongans | 99.2 /100 | #44 | Exceptional 11.9% |
| Immigrants | Czechoslovakia | 99.2 /100 | #45 | Exceptional 11.9% |
| Turks | 99.2 /100 | #46 | Exceptional 11.9% |
| Asians | 99.1 /100 | #47 | Exceptional 11.9% |
| Immigrants | Japan | 99.0 /100 | #48 | Exceptional 11.9% |
| Immigrants | Romania | 99.0 /100 | #49 | Exceptional 12.0% |
| Slovenes | 98.9 /100 | #50 | Exceptional 12.0% |
| Immigrants | Bulgaria | 98.9 /100 | #51 | Exceptional 12.0% |
| Immigrants | Croatia | 98.7 /100 | #52 | Exceptional 12.0% |
| Immigrants | Austria | 98.7 /100 | #53 | Exceptional 12.0% |
| Immigrants | Philippines | 98.7 /100 | #54 | Exceptional 12.1% |
| Immigrants | Sri Lanka | 98.5 /100 | #55 | Exceptional 12.1% |
| Estonians | 98.3 /100 | #56 | Exceptional 12.1% |
| Immigrants | Serbia | 98.3 /100 | #57 | Exceptional 12.1% |
| Scandinavians | 98.2 /100 | #58 | Exceptional 12.1% |
Demographics Similar to British West Indians by Female Poverty
In terms of female poverty, the demographic groups most similar to British West Indians are Immigrants from Somalia (17.0%, a difference of 0.080%), Creek (17.0%, a difference of 0.17%), Immigrants from Guatemala (17.0%, a difference of 0.17%), Dutch West Indian (17.1%, a difference of 0.25%), and Immigrants from Mexico (17.0%, a difference of 0.41%).
| Demographics | Rating | Rank | Female Poverty |
| Immigrants | Caribbean | 0.0 /100 | #306 | Tragic 16.9% |
| Seminole | 0.0 /100 | #307 | Tragic 16.9% |
| Africans | 0.0 /100 | #308 | Tragic 16.9% |
| Immigrants | Mexico | 0.0 /100 | #309 | Tragic 17.0% |
| Creek | 0.0 /100 | #310 | Tragic 17.0% |
| Immigrants | Guatemala | 0.0 /100 | #311 | Tragic 17.0% |
| Immigrants | Somalia | 0.0 /100 | #312 | Tragic 17.0% |
| British West Indians | 0.0 /100 | #313 | Tragic 17.0% |
| Dutch West Indians | 0.0 /100 | #314 | Tragic 17.1% |
| U.S. Virgin Islanders | 0.0 /100 | #315 | Tragic 17.3% |
| Hondurans | 0.0 /100 | #316 | Tragic 17.4% |
| Immigrants | Congo | 0.0 /100 | #317 | Tragic 17.4% |
| Ute | 0.0 /100 | #318 | Tragic 17.5% |
| Cajuns | 0.0 /100 | #319 | Tragic 17.5% |
| Immigrants | Dominica | 0.0 /100 | #320 | Tragic 17.5% |