Immigrants from Belarus vs Norwegian Seniors Poverty Over the Age of 75
COMPARE
Immigrants from Belarus
Norwegian
Seniors Poverty Over the Age of 75
Seniors Poverty Over the Age of 75 Comparison
Immigrants from Belarus
Norwegians
13.8%
SENIORS POVERTY OVER THE AGE OF 75
0.2/ 100
METRIC RATING
255th/ 347
METRIC RANK
10.2%
SENIORS POVERTY OVER THE AGE OF 75
100.0/ 100
METRIC RATING
5th/ 347
METRIC RANK
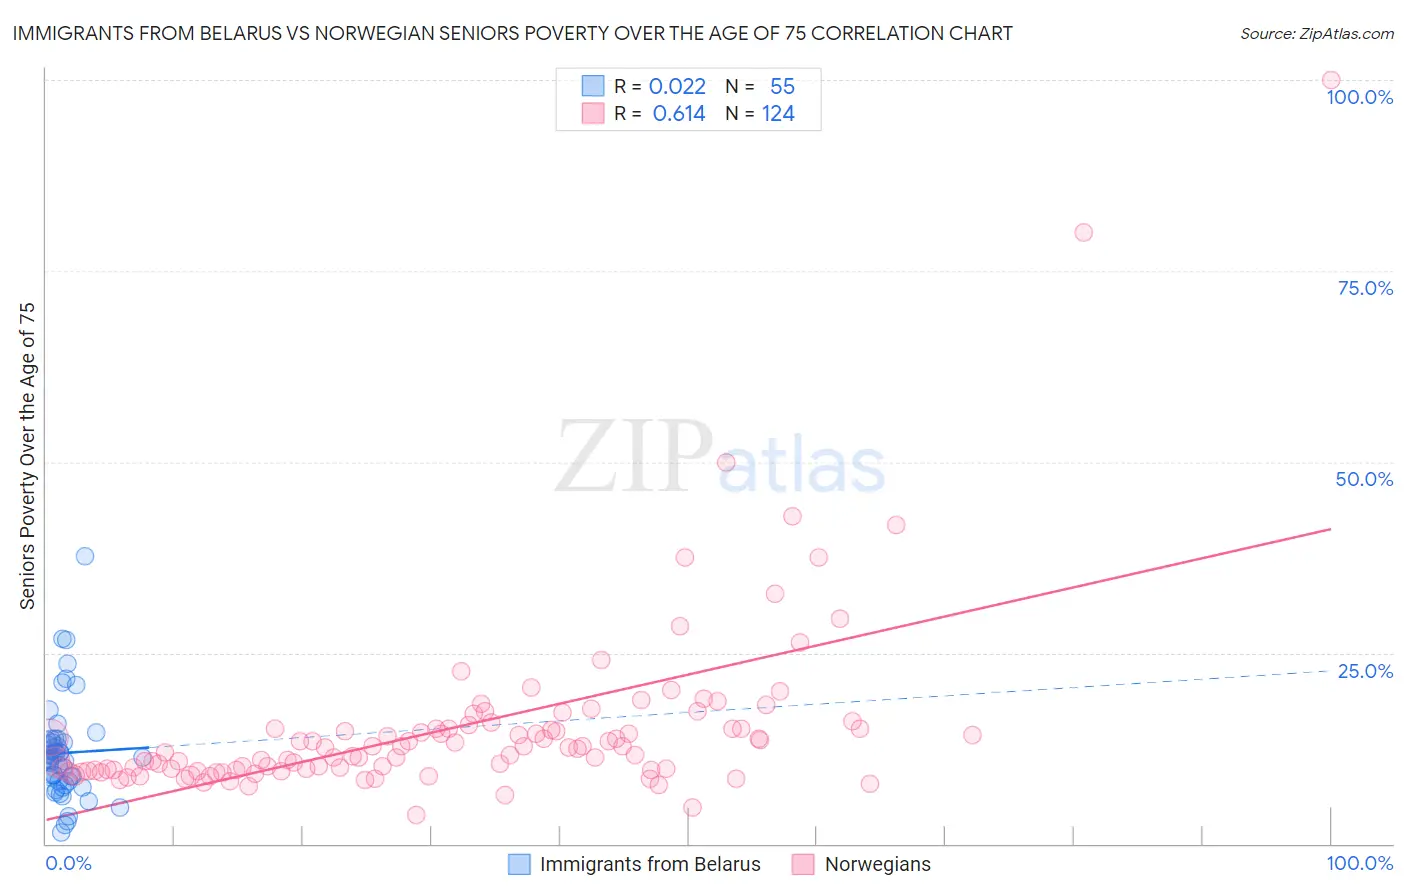
Immigrants from Belarus vs Norwegian Seniors Poverty Over the Age of 75 Correlation Chart
The statistical analysis conducted on geographies consisting of 149,396,429 people shows no correlation between the proportion of Immigrants from Belarus and poverty level among seniors over the age of 75 in the United States with a correlation coefficient (R) of 0.022 and weighted average of 13.8%. Similarly, the statistical analysis conducted on geographies consisting of 520,068,744 people shows a significant positive correlation between the proportion of Norwegians and poverty level among seniors over the age of 75 in the United States with a correlation coefficient (R) of 0.614 and weighted average of 10.2%, a difference of 35.0%.
Seniors Poverty Over the Age of 75 Correlation Summary
| Measurement | Immigrants from Belarus | Norwegian |
| Minimum | 1.5% | 3.8% |
| Maximum | 37.7% | 100.0% |
| Range | 36.2% | 96.2% |
| Mean | 11.9% | 15.3% |
| Median | 11.1% | 12.5% |
| Interquartile 25% (IQ1) | 8.1% | 9.6% |
| Interquartile 75% (IQ3) | 13.4% | 15.1% |
| Interquartile Range (IQR) | 5.3% | 5.4% |
| Standard Deviation (Sample) | 6.5% | 12.2% |
| Standard Deviation (Population) | 6.4% | 12.2% |
Similar Demographics by Seniors Poverty Over the Age of 75
Demographics Similar to Immigrants from Belarus by Seniors Poverty Over the Age of 75
In terms of seniors poverty over the age of 75, the demographic groups most similar to Immigrants from Belarus are Blackfeet (13.7%, a difference of 0.43%), Inupiat (13.8%, a difference of 0.50%), Immigrants from Spain (13.7%, a difference of 0.54%), Immigrants from Argentina (13.7%, a difference of 0.76%), and Immigrants from Peru (13.7%, a difference of 0.81%).
| Demographics | Rating | Rank | Seniors Poverty Over the Age of 75 |
| Africans | 0.3 /100 | #248 | Tragic 13.6% |
| Immigrants | Albania | 0.3 /100 | #249 | Tragic 13.6% |
| Mexican American Indians | 0.3 /100 | #250 | Tragic 13.6% |
| Immigrants | Peru | 0.3 /100 | #251 | Tragic 13.7% |
| Immigrants | Argentina | 0.3 /100 | #252 | Tragic 13.7% |
| Immigrants | Spain | 0.2 /100 | #253 | Tragic 13.7% |
| Blackfeet | 0.2 /100 | #254 | Tragic 13.7% |
| Immigrants | Belarus | 0.2 /100 | #255 | Tragic 13.8% |
| Inupiat | 0.1 /100 | #256 | Tragic 13.8% |
| Immigrants | Western Africa | 0.1 /100 | #257 | Tragic 13.9% |
| Immigrants | Panama | 0.1 /100 | #258 | Tragic 13.9% |
| Immigrants | Portugal | 0.1 /100 | #259 | Tragic 13.9% |
| Immigrants | Immigrants | 0.1 /100 | #260 | Tragic 13.9% |
| Ghanaians | 0.1 /100 | #261 | Tragic 14.0% |
| Cajuns | 0.1 /100 | #262 | Tragic 14.0% |
Demographics Similar to Norwegians by Seniors Poverty Over the Age of 75
In terms of seniors poverty over the age of 75, the demographic groups most similar to Norwegians are Danish (10.2%, a difference of 0.27%), Swedish (10.2%, a difference of 0.40%), Maltese (10.3%, a difference of 0.92%), Native Hawaiian (10.1%, a difference of 1.3%), and German (10.4%, a difference of 1.5%).
| Demographics | Rating | Rank | Seniors Poverty Over the Age of 75 |
| Chinese | 100.0 /100 | #1 | Exceptional 9.1% |
| Tlingit-Haida | 100.0 /100 | #2 | Exceptional 9.7% |
| Native Hawaiians | 100.0 /100 | #3 | Exceptional 10.1% |
| Swedes | 100.0 /100 | #4 | Exceptional 10.2% |
| Norwegians | 100.0 /100 | #5 | Exceptional 10.2% |
| Danes | 100.0 /100 | #6 | Exceptional 10.2% |
| Maltese | 100.0 /100 | #7 | Exceptional 10.3% |
| Germans | 99.9 /100 | #8 | Exceptional 10.4% |
| English | 99.9 /100 | #9 | Exceptional 10.4% |
| Scandinavians | 99.9 /100 | #10 | Exceptional 10.4% |
| Immigrants | India | 99.9 /100 | #11 | Exceptional 10.4% |
| Tongans | 99.9 /100 | #12 | Exceptional 10.5% |
| Croatians | 99.9 /100 | #13 | Exceptional 10.5% |
| Scottish | 99.9 /100 | #14 | Exceptional 10.5% |
| Europeans | 99.9 /100 | #15 | Exceptional 10.5% |