Immigrants from Belarus vs Norwegian Male Unemployment
COMPARE
Immigrants from Belarus
Norwegian
Male Unemployment
Male Unemployment Comparison
Immigrants from Belarus
Norwegians
5.4%
MALE UNEMPLOYMENT
26.0/ 100
METRIC RATING
192nd/ 347
METRIC RANK
4.4%
MALE UNEMPLOYMENT
100.0/ 100
METRIC RATING
3rd/ 347
METRIC RANK
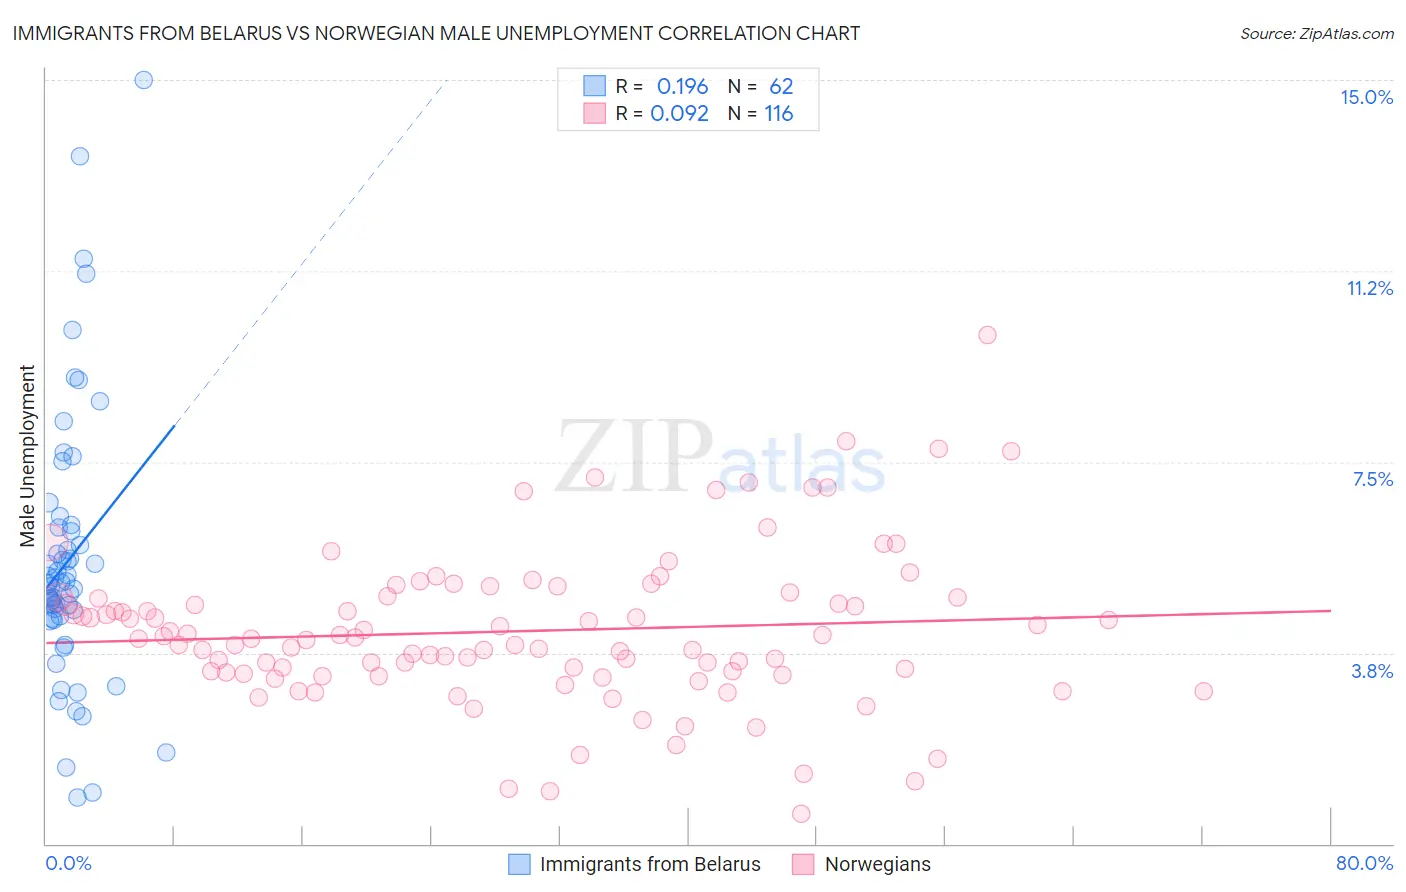
Immigrants from Belarus vs Norwegian Male Unemployment Correlation Chart
The statistical analysis conducted on geographies consisting of 150,060,028 people shows a poor positive correlation between the proportion of Immigrants from Belarus and unemployment rate among males in the United States with a correlation coefficient (R) of 0.196 and weighted average of 5.4%. Similarly, the statistical analysis conducted on geographies consisting of 525,648,173 people shows a slight positive correlation between the proportion of Norwegians and unemployment rate among males in the United States with a correlation coefficient (R) of 0.092 and weighted average of 4.4%, a difference of 21.2%.
Male Unemployment Correlation Summary
| Measurement | Immigrants from Belarus | Norwegian |
| Minimum | 0.90% | 0.60% |
| Maximum | 15.0% | 10.0% |
| Range | 14.1% | 9.4% |
| Mean | 5.6% | 4.2% |
| Median | 5.1% | 4.0% |
| Interquartile 25% (IQ1) | 4.4% | 3.4% |
| Interquartile 75% (IQ3) | 6.2% | 4.8% |
| Interquartile Range (IQR) | 1.8% | 1.5% |
| Standard Deviation (Sample) | 2.7% | 1.5% |
| Standard Deviation (Population) | 2.7% | 1.5% |
Similar Demographics by Male Unemployment
Demographics Similar to Immigrants from Belarus by Male Unemployment
In terms of male unemployment, the demographic groups most similar to Immigrants from Belarus are Immigrants from Israel (5.4%, a difference of 0.060%), Immigrants from South Eastern Asia (5.4%, a difference of 0.16%), Immigrants from Uganda (5.4%, a difference of 0.20%), Immigrants from South America (5.4%, a difference of 0.24%), and Arab (5.4%, a difference of 0.30%).
| Demographics | Rating | Rank | Male Unemployment |
| Koreans | 34.9 /100 | #185 | Fair 5.3% |
| Iraqis | 31.6 /100 | #186 | Fair 5.4% |
| Costa Ricans | 31.3 /100 | #187 | Fair 5.4% |
| Arabs | 30.2 /100 | #188 | Fair 5.4% |
| Immigrants | South America | 29.4 /100 | #189 | Fair 5.4% |
| Immigrants | Uganda | 28.8 /100 | #190 | Fair 5.4% |
| Immigrants | South Eastern Asia | 28.2 /100 | #191 | Fair 5.4% |
| Immigrants | Belarus | 26.0 /100 | #192 | Fair 5.4% |
| Immigrants | Israel | 25.2 /100 | #193 | Fair 5.4% |
| Spanish | 19.7 /100 | #194 | Poor 5.4% |
| Immigrants | Southern Europe | 17.7 /100 | #195 | Poor 5.4% |
| Albanians | 17.3 /100 | #196 | Poor 5.4% |
| Alsatians | 16.7 /100 | #197 | Poor 5.4% |
| Immigrants | Thailand | 14.7 /100 | #198 | Poor 5.4% |
| Immigrants | Greece | 14.5 /100 | #199 | Poor 5.4% |
Demographics Similar to Norwegians by Male Unemployment
In terms of male unemployment, the demographic groups most similar to Norwegians are Immigrants from Cuba (4.4%, a difference of 0.24%), Immigrants from Venezuela (4.4%, a difference of 0.33%), Immigrants from India (4.4%, a difference of 1.3%), Danish (4.5%, a difference of 1.4%), and Venezuelan (4.5%, a difference of 1.8%).
| Demographics | Rating | Rank | Male Unemployment |
| Immigrants | India | 100.0 /100 | #1 | Exceptional 4.4% |
| Immigrants | Cuba | 100.0 /100 | #2 | Exceptional 4.4% |
| Norwegians | 100.0 /100 | #3 | Exceptional 4.4% |
| Immigrants | Venezuela | 100.0 /100 | #4 | Exceptional 4.4% |
| Danes | 100.0 /100 | #5 | Exceptional 4.5% |
| Venezuelans | 100.0 /100 | #6 | Exceptional 4.5% |
| Czechs | 100.0 /100 | #7 | Exceptional 4.5% |
| Luxembourgers | 100.0 /100 | #8 | Exceptional 4.5% |
| Thais | 100.0 /100 | #9 | Exceptional 4.6% |
| Cubans | 100.0 /100 | #10 | Exceptional 4.6% |
| Swedes | 100.0 /100 | #11 | Exceptional 4.6% |
| Immigrants | Bolivia | 100.0 /100 | #12 | Exceptional 4.7% |
| Bolivians | 100.0 /100 | #13 | Exceptional 4.7% |
| Germans | 100.0 /100 | #14 | Exceptional 4.7% |
| Scandinavians | 100.0 /100 | #15 | Exceptional 4.7% |