Immigrants from Belarus vs Immigrants from Kuwait Married-Couple Family Poverty

COMPARE

Immigrants from Belarus
Race
Ancestry
AfghanAfricanAlaska NativeAlaskan AthabascanAlbanianAleutAlsatianAmericanApacheArabArapahoArgentineanArmenianAssyrian/Chaldean/SyriacAustralianAustrianBahamianBangladeshiBarbadianBasqueBelgianBelizeanBermudanBhutaneseBlackfeetBolivianBrazilianBritishBritish West IndianBulgarianBurmeseCajunCambodianCanadianCape VerdeanCarpatho RusynCelticCentral AmericanCentral American IndianCherokeeCheyenneChickasawChileanChineseChippewaChoctawColombianColvilleComancheCosta RicanCreeCreekCroatianCrowCubanCypriotCzechCzechoslovakianDanishDelawareDominicanDutchDutch West IndianEastern EuropeanEcuadorianEgyptianEnglishEstonianEthiopianEuropeanFijianFilipinoFinnishFrenchFrench American IndianFrench CanadianGermanGerman RussianGhanaianGreekGuamanian/ChamorroGuatemalanGuyaneseHaitianHmongHonduranHopiHoumaHungarianIcelanderIndian (Asian)IndonesianInupiatIranianIraqiIrishIroquoisIsraeliItalianJamaicanJapaneseJordanianKenyanKiowaKoreanLaotianLatvianLebaneseLiberianLithuanianLumbeeLuxembourgerMacedonianMalaysianMalteseMarshalleseMenomineeMexicanMexican American IndianMongolianMoroccanNative HawaiianNavajoNepaleseNew ZealanderNicaraguanNigerianNorthern EuropeanNorwegianOkinawanOsageOttawaPaiutePakistaniPalestinianPanamanianParaguayanPennsylvania GermanPeruvianPimaPolishPortuguesePotawatomiPuebloPuerto RicanPuget Sound SalishRomanianRussianSalvadoranSamoanScandinavianScotch-IrishScottishSeminoleSenegaleseSerbianShoshoneSierra LeoneanSiouxSlavicSlovakSloveneSomaliSouth AfricanSouth AmericanSouth American IndianSoviet UnionSpaniardSpanishSpanish AmericanSpanish American IndianSri LankanSubsaharan AfricanSudaneseSwedishSwissSyrianTaiwaneseThaiTlingit-HaidaTohono O'OdhamTonganTrinidadian and TobagonianTsimshianTurkishU.S. Virgin IslanderUgandanUkrainianUruguayanUteVenezuelanVietnameseWelshWest IndianYakamaYaquiYugoslavianYumanYup'ikZimbabwean
Immigration
NonimmigrantsImmigrantsAfghanistanAfricaAlbaniaArgentinaArmeniaAsiaAustraliaAustriaBahamasBangladeshBarbadosBelarusBelgiumBelizeBoliviaBosnia and HerzegovinaBrazilBulgariaBurma/MyanmarCabo VerdeCambodiaCameroonCanadaCaribbeanCentral AmericaChileChinaColombiaCongoCosta RicaCroatiaCubaCzechoslovakiaDenmarkDominicaDominican RepublicEastern AfricaEastern AsiaEastern EuropeEcuadorEgyptEl SalvadorEnglandEritreaEthiopiaEuropeFijiFranceGermanyGhanaGreeceGrenadaGuatemalaGuyanaHaitiHondurasHong KongHungaryIndiaIndonesiaIranIraqIrelandIsraelItalyJamaicaJapanJordanKazakhstanKenyaKoreaLaosLatin AmericaLatviaLebanonLiberiaLithuaniaMalaysiaMexicoMicronesiaMiddle AfricaMoldovaMoroccoNepalNetherlandsNicaraguaNigeriaNorth AmericaNorth MacedoniaNorthern AfricaNorthern EuropeNorwayOceaniaPakistanPanamaPeruPhilippinesPolandPortugalRomaniaRussiaSaudi ArabiaScotlandSenegalSerbiaSierra LeoneSingaporeSomaliaSouth AfricaSouth AmericaSouth Central AsiaSouth Eastern AsiaSouthern EuropeSpainSri LankaSt. Vincent and the GrenadinesSudanSwedenSwitzerlandSyriaTaiwanThailandTrinidad and TobagoTurkeyUgandaUkraineUruguayUzbekistanVenezuelaVietnamWest IndiesWestern AfricaWestern AsiaWestern EuropeYemenZaireZimbabweAzores
Immigrants from Kuwait
Race
Ancestry
AfghanAfricanAlaska NativeAlaskan AthabascanAlbanianAleutAlsatianAmericanApacheArabArapahoArgentineanArmenianAssyrian/Chaldean/SyriacAustralianAustrianBahamianBangladeshiBarbadianBasqueBelgianBelizeanBermudanBhutaneseBlackfeetBolivianBrazilianBritishBritish West IndianBulgarianBurmeseCajunCambodianCanadianCape VerdeanCarpatho RusynCelticCentral AmericanCentral American IndianCherokeeCheyenneChickasawChileanChineseChippewaChoctawColombianColvilleComancheCosta RicanCreeCreekCroatianCrowCubanCypriotCzechCzechoslovakianDanishDelawareDominicanDutchDutch West IndianEastern EuropeanEcuadorianEgyptianEnglishEstonianEthiopianEuropeanFijianFilipinoFinnishFrenchFrench American IndianFrench CanadianGermanGerman RussianGhanaianGreekGuamanian/ChamorroGuatemalanGuyaneseHaitianHmongHonduranHopiHoumaHungarianIcelanderIndian (Asian)IndonesianInupiatIranianIraqiIrishIroquoisIsraeliItalianJamaicanJapaneseJordanianKenyanKiowaKoreanLaotianLatvianLebaneseLiberianLithuanianLumbeeLuxembourgerMacedonianMalaysianMalteseMarshalleseMenomineeMexicanMexican American IndianMongolianMoroccanNative HawaiianNavajoNepaleseNew ZealanderNicaraguanNigerianNorthern EuropeanNorwegianOkinawanOsageOttawaPaiutePakistaniPalestinianPanamanianParaguayanPennsylvania GermanPeruvianPimaPolishPortuguesePotawatomiPuebloPuerto RicanPuget Sound SalishRomanianRussianSalvadoranSamoanScandinavianScotch-IrishScottishSeminoleSenegaleseSerbianShoshoneSierra LeoneanSiouxSlavicSlovakSloveneSomaliSouth AfricanSouth AmericanSouth American IndianSoviet UnionSpaniardSpanishSpanish AmericanSpanish American IndianSri LankanSubsaharan AfricanSudaneseSwedishSwissSyrianTaiwaneseThaiTlingit-HaidaTohono O'OdhamTonganTrinidadian and TobagonianTsimshianTurkishU.S. Virgin IslanderUgandanUkrainianUruguayanUteVenezuelanVietnameseWelshWest IndianYakamaYaquiYugoslavianYumanYup'ikZimbabwean
Immigration
NonimmigrantsImmigrantsAfghanistanAfricaAlbaniaArgentinaArmeniaAsiaAustraliaAustriaBahamasBangladeshBarbadosBelgiumBelizeBoliviaBosnia and HerzegovinaBrazilBulgariaBurma/MyanmarCabo VerdeCambodiaCameroonCanadaCaribbeanCentral AmericaChileChinaColombiaCongoCosta RicaCroatiaCubaCzechoslovakiaDenmarkDominicaDominican RepublicEastern AfricaEastern AsiaEastern EuropeEcuadorEgyptEl SalvadorEnglandEritreaEthiopiaEuropeFijiFranceGermanyGhanaGreeceGrenadaGuatemalaGuyanaHaitiHondurasHong KongHungaryIndiaIndonesiaIranIraqIrelandIsraelItalyJamaicaJapanJordanKazakhstanKenyaKoreaKuwaitLaosLatin AmericaLatviaLebanonLiberiaLithuaniaMalaysiaMexicoMicronesiaMiddle AfricaMoldovaMoroccoNepalNetherlandsNicaraguaNigeriaNorth AmericaNorth MacedoniaNorthern AfricaNorthern EuropeNorwayOceaniaPakistanPanamaPeruPhilippinesPolandPortugalRomaniaRussiaSaudi ArabiaScotlandSenegalSerbiaSierra LeoneSingaporeSomaliaSouth AfricaSouth AmericaSouth Central AsiaSouth Eastern AsiaSouthern EuropeSpainSri LankaSt. Vincent and the GrenadinesSudanSwedenSwitzerlandSyriaTaiwanThailandTrinidad and TobagoTurkeyUgandaUkraineUruguayUzbekistanVenezuelaVietnamWest IndiesWestern AfricaWestern AsiaWestern EuropeYemenZaireZimbabweAzores
Married-Couple Family Poverty
Income
Poverty
Unemployment
Labor Participation
Family Structure
Vehicle Availability
Education Level
Disability

Married-Couple Family Poverty Comparison

Immigrants from Belarus

Immigrants from Kuwait

Fair
Good
5.4%
MARRIED-COUPLE FAMILY POVERTY
26.2/ 100
METRIC RATING
198th/ 347
METRIC RANK
5.0%
MARRIED-COUPLE FAMILY POVERTY
76.3/ 100
METRIC RATING
153rd/ 347
METRIC RANK

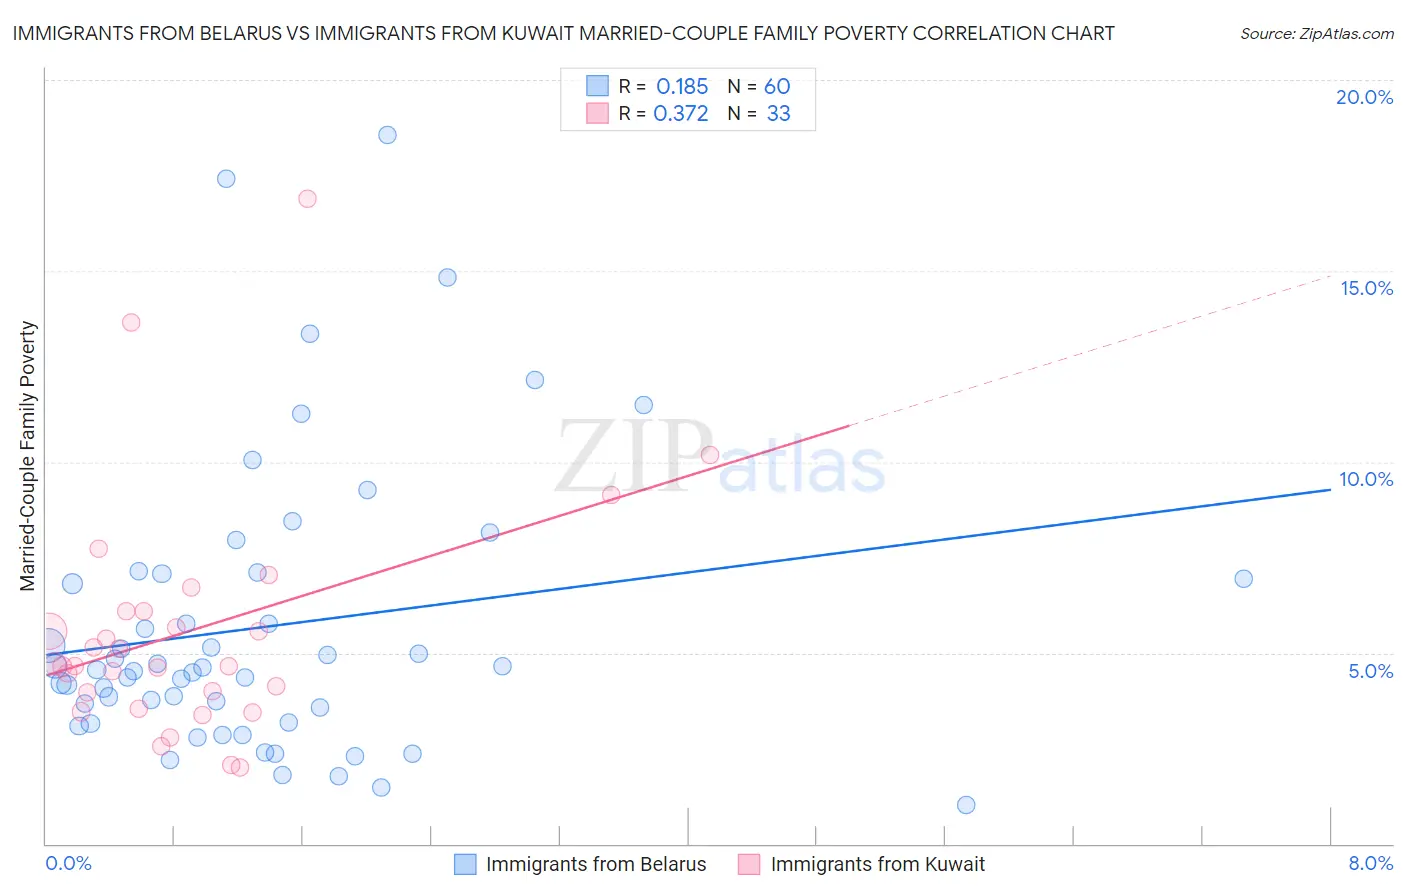
Immigrants from Belarus vs Immigrants from Kuwait Married-Couple Family Poverty Correlation Chart

The statistical analysis conducted on geographies consisting of 149,577,130 people shows a poor positive correlation between the proportion of Immigrants from Belarus and poverty level among married-couple families in the United States with a correlation coefficient (R) of 0.185 and weighted average of 5.4%. Similarly, the statistical analysis conducted on geographies consisting of 136,568,646 people shows a mild positive correlation between the proportion of Immigrants from Kuwait and poverty level among married-couple families in the United States with a correlation coefficient (R) of 0.372 and weighted average of 5.0%, a difference of 6.6%.
Immigrants from Belarus vs Immigrants from Kuwait Married-Couple Family Poverty

Married-Couple Family Poverty Correlation Summary

MeasurementImmigrants from BelarusImmigrants from Kuwait
Minimum1.0%2.0%
Maximum18.5%16.9%
Range17.5%14.9%
Mean5.7%5.6%
Median4.6%4.7%
Interquartile 25% (IQ1)3.4%3.8%
Interquartile 75% (IQ3)7.0%6.1%
Interquartile Range (IQR)3.6%2.3%
Standard Deviation (Sample)3.7%3.1%
Standard Deviation (Population)3.7%3.1%

Similar Demographics by Married-Couple Family Poverty

Demographics Similar to Immigrants from Belarus by Married-Couple Family Poverty

In terms of married-couple family poverty, the demographic groups most similar to Immigrants from Belarus are Liberian (5.4%, a difference of 0.020%), Spaniard (5.4%, a difference of 0.18%), Uruguayan (5.4%, a difference of 0.18%), Immigrants from the Azores (5.4%, a difference of 0.20%), and Immigrants from Israel (5.4%, a difference of 0.24%).
DemographicsRating | RankMarried-Couple Family Poverty
Immigrants | Cabo Verde
30.9
/100
|
#191
Fair
5.3%
Cape Verdeans
30.7
/100
|
#192
Fair
5.3%
Malaysians
29.5
/100
|
#193
Fair
5.4%
Immigrants | Israel
27.8
/100
|
#194
Fair
5.4%
Immigrants | Azores
27.5
/100
|
#195
Fair
5.4%
Spaniards
27.4
/100
|
#196
Fair
5.4%
Liberians
26.3
/100
|
#197
Fair
5.4%
Immigrants | Belarus
26.2
/100
|
#198
Fair
5.4%
Uruguayans
25.0
/100
|
#199
Fair
5.4%
Immigrants | Morocco
24.3
/100
|
#200
Fair
5.4%
Lebanese
24.1
/100
|
#201
Fair
5.4%
Immigrants | Middle Africa
23.8
/100
|
#202
Fair
5.4%
Immigrants | Peru
21.8
/100
|
#203
Fair
5.4%
Immigrants | Costa Rica
19.4
/100
|
#204
Poor
5.4%
Chippewa
18.9
/100
|
#205
Poor
5.4%

Demographics Similar to Immigrants from Kuwait by Married-Couple Family Poverty

In terms of married-couple family poverty, the demographic groups most similar to Immigrants from Kuwait are Albanian (5.0%, a difference of 0.15%), Immigrants from Cameroon (5.0%, a difference of 0.16%), Brazilian (5.0%, a difference of 0.33%), Immigrants from Oceania (5.0%, a difference of 0.38%), and Syrian (5.0%, a difference of 0.41%).
DemographicsRating | RankMarried-Couple Family Poverty
Mongolians
79.8
/100
|
#146
Good
5.0%
Syrians
78.7
/100
|
#147
Good
5.0%
Immigrants | Russia
78.7
/100
|
#148
Good
5.0%
Immigrants | Oceania
78.6
/100
|
#149
Good
5.0%
Brazilians
78.3
/100
|
#150
Good
5.0%
Immigrants | Cameroon
77.3
/100
|
#151
Good
5.0%
Albanians
77.2
/100
|
#152
Good
5.0%
Immigrants | Kuwait
76.3
/100
|
#153
Good
5.0%
Delaware
73.7
/100
|
#154
Good
5.1%
Immigrants | Ethiopia
72.4
/100
|
#155
Good
5.1%
Sri Lankans
72.2
/100
|
#156
Good
5.1%
Argentineans
70.7
/100
|
#157
Good
5.1%
Immigrants | South Eastern Asia
70.4
/100
|
#158
Good
5.1%
Immigrants | Saudi Arabia
70.3
/100
|
#159
Good
5.1%
Pennsylvania Germans
68.5
/100
|
#160
Good
5.1%