Immigrants from Bahamas vs Scotch-Irish Median Household Income
COMPARE
Immigrants from Bahamas
Scotch-Irish
Median Household Income
Median Household Income Comparison
Immigrants from Bahamas
Scotch-Irish
$71,349
MEDIAN HOUSEHOLD INCOME
0.0/ 100
METRIC RATING
313th/ 347
METRIC RANK
$80,972
MEDIAN HOUSEHOLD INCOME
6.6/ 100
METRIC RATING
225th/ 347
METRIC RANK
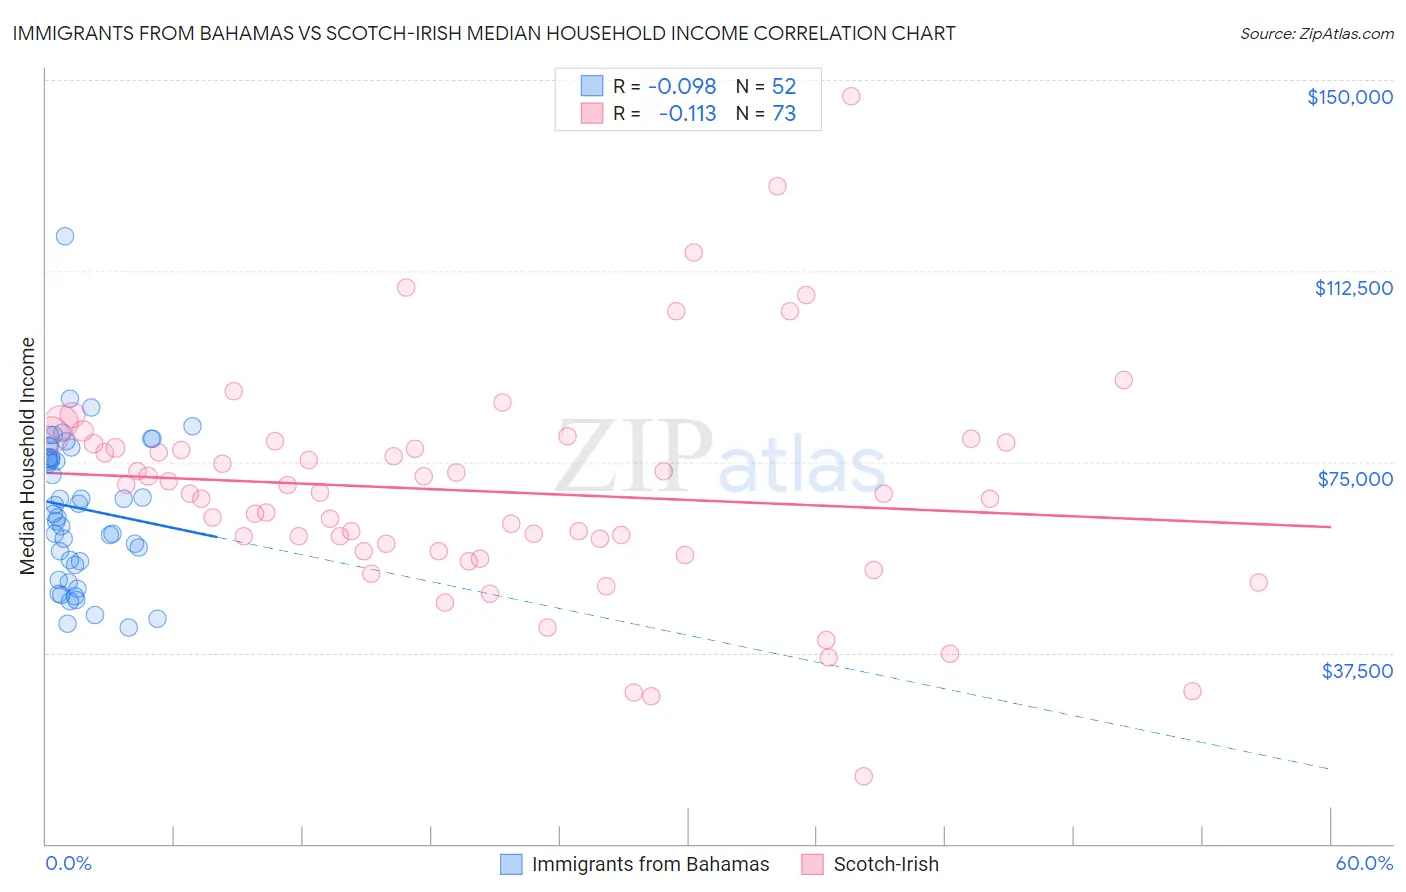
Immigrants from Bahamas vs Scotch-Irish Median Household Income Correlation Chart
The statistical analysis conducted on geographies consisting of 104,583,931 people shows a slight negative correlation between the proportion of Immigrants from Bahamas and median household income in the United States with a correlation coefficient (R) of -0.098 and weighted average of $71,349. Similarly, the statistical analysis conducted on geographies consisting of 548,026,119 people shows a poor negative correlation between the proportion of Scotch-Irish and median household income in the United States with a correlation coefficient (R) of -0.113 and weighted average of $80,972, a difference of 13.5%.
Median Household Income Correlation Summary
| Measurement | Immigrants from Bahamas | Scotch-Irish |
| Minimum | $42,496 | $13,333 |
| Maximum | $119,201 | $146,875 |
| Range | $76,705 | $133,542 |
| Mean | $65,863 | $69,187 |
| Median | $65,628 | $68,778 |
| Interquartile 25% (IQ1) | $55,065 | $57,401 |
| Interquartile 75% (IQ3) | $76,891 | $78,673 |
| Interquartile Range (IQR) | $21,825 | $21,272 |
| Standard Deviation (Sample) | $14,679 | $22,180 |
| Standard Deviation (Population) | $14,537 | $22,027 |
Similar Demographics by Median Household Income
Demographics Similar to Immigrants from Bahamas by Median Household Income
In terms of median household income, the demographic groups most similar to Immigrants from Bahamas are Dominican ($71,302, a difference of 0.060%), Immigrants from Honduras ($71,452, a difference of 0.15%), Ottawa ($70,984, a difference of 0.51%), Apache ($70,927, a difference of 0.59%), and Immigrants from Zaire ($71,801, a difference of 0.63%).
| Demographics | Rating | Rank | Median Household Income |
| Potawatomi | 0.0 /100 | #306 | Tragic $72,576 |
| Ute | 0.0 /100 | #307 | Tragic $72,402 |
| Yakama | 0.0 /100 | #308 | Tragic $72,225 |
| Immigrants | Caribbean | 0.0 /100 | #309 | Tragic $71,860 |
| U.S. Virgin Islanders | 0.0 /100 | #310 | Tragic $71,853 |
| Immigrants | Zaire | 0.0 /100 | #311 | Tragic $71,801 |
| Immigrants | Honduras | 0.0 /100 | #312 | Tragic $71,452 |
| Immigrants | Bahamas | 0.0 /100 | #313 | Tragic $71,349 |
| Dominicans | 0.0 /100 | #314 | Tragic $71,302 |
| Ottawa | 0.0 /100 | #315 | Tragic $70,984 |
| Apache | 0.0 /100 | #316 | Tragic $70,927 |
| Cajuns | 0.0 /100 | #317 | Tragic $70,605 |
| Chippewa | 0.0 /100 | #318 | Tragic $70,539 |
| Immigrants | Dominican Republic | 0.0 /100 | #319 | Tragic $70,208 |
| Colville | 0.0 /100 | #320 | Tragic $70,094 |
Demographics Similar to Scotch-Irish by Median Household Income
In terms of median household income, the demographic groups most similar to Scotch-Irish are Malaysian ($81,064, a difference of 0.11%), Immigrants from Panama ($80,873, a difference of 0.12%), Guyanese ($80,734, a difference of 0.29%), Immigrants from El Salvador ($81,213, a difference of 0.30%), and Immigrants from Bangladesh ($80,722, a difference of 0.31%).
| Demographics | Rating | Rank | Median Household Income |
| Whites/Caucasians | 12.2 /100 | #218 | Poor $82,029 |
| Nigerians | 10.3 /100 | #219 | Poor $81,725 |
| Immigrants | Venezuela | 9.0 /100 | #220 | Tragic $81,506 |
| Immigrants | Ghana | 9.0 /100 | #221 | Tragic $81,489 |
| Immigrants | Nigeria | 7.7 /100 | #222 | Tragic $81,236 |
| Immigrants | El Salvador | 7.6 /100 | #223 | Tragic $81,213 |
| Malaysians | 7.0 /100 | #224 | Tragic $81,064 |
| Scotch-Irish | 6.6 /100 | #225 | Tragic $80,972 |
| Immigrants | Panama | 6.2 /100 | #226 | Tragic $80,873 |
| Guyanese | 5.7 /100 | #227 | Tragic $80,734 |
| Immigrants | Bangladesh | 5.7 /100 | #228 | Tragic $80,722 |
| Delaware | 5.0 /100 | #229 | Tragic $80,527 |
| Bermudans | 4.7 /100 | #230 | Tragic $80,406 |
| Trinidadians and Tobagonians | 4.7 /100 | #231 | Tragic $80,402 |
| Immigrants | Trinidad and Tobago | 4.6 /100 | #232 | Tragic $80,373 |