Immigrants from Bahamas vs Scotch-Irish Male Poverty
COMPARE
Immigrants from Bahamas
Scotch-Irish
Male Poverty
Male Poverty Comparison
Immigrants from Bahamas
Scotch-Irish
13.5%
MALE POVERTY
0.0/ 100
METRIC RATING
272nd/ 347
METRIC RANK
11.0%
MALE POVERTY
63.7/ 100
METRIC RATING
157th/ 347
METRIC RANK
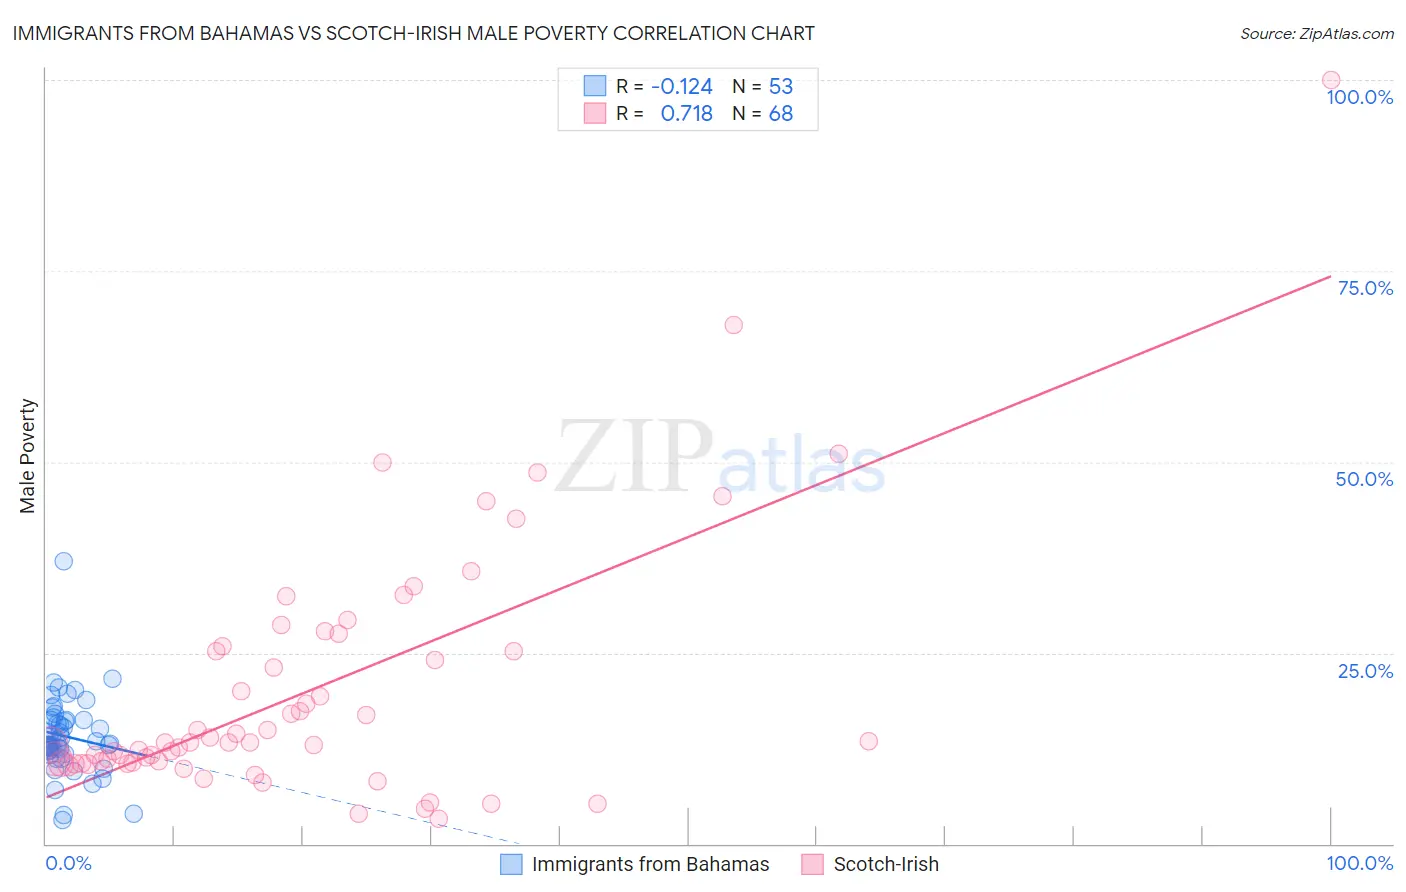
Immigrants from Bahamas vs Scotch-Irish Male Poverty Correlation Chart
The statistical analysis conducted on geographies consisting of 104,609,154 people shows a poor negative correlation between the proportion of Immigrants from Bahamas and poverty level among males in the United States with a correlation coefficient (R) of -0.124 and weighted average of 13.5%. Similarly, the statistical analysis conducted on geographies consisting of 547,595,685 people shows a strong positive correlation between the proportion of Scotch-Irish and poverty level among males in the United States with a correlation coefficient (R) of 0.718 and weighted average of 11.0%, a difference of 21.9%.
Male Poverty Correlation Summary
| Measurement | Immigrants from Bahamas | Scotch-Irish |
| Minimum | 3.1% | 3.2% |
| Maximum | 37.0% | 100.0% |
| Range | 33.9% | 96.8% |
| Mean | 14.0% | 20.1% |
| Median | 13.0% | 13.3% |
| Interquartile 25% (IQ1) | 11.9% | 10.6% |
| Interquartile 75% (IQ3) | 16.2% | 25.5% |
| Interquartile Range (IQR) | 4.3% | 14.9% |
| Standard Deviation (Sample) | 5.2% | 16.5% |
| Standard Deviation (Population) | 5.2% | 16.4% |
Similar Demographics by Male Poverty
Demographics Similar to Immigrants from Bahamas by Male Poverty
In terms of male poverty, the demographic groups most similar to Immigrants from Bahamas are Chickasaw (13.5%, a difference of 0.29%), Immigrants from West Indies (13.5%, a difference of 0.37%), Spanish American (13.4%, a difference of 0.75%), Cree (13.3%, a difference of 0.78%), and Barbadian (13.6%, a difference of 0.99%).
| Demographics | Rating | Rank | Male Poverty |
| Jamaicans | 0.1 /100 | #265 | Tragic 13.2% |
| Immigrants | Guyana | 0.1 /100 | #266 | Tragic 13.2% |
| Immigrants | Jamaica | 0.1 /100 | #267 | Tragic 13.3% |
| Sub-Saharan Africans | 0.1 /100 | #268 | Tragic 13.3% |
| Guyanese | 0.0 /100 | #269 | Tragic 13.3% |
| Cree | 0.0 /100 | #270 | Tragic 13.3% |
| Spanish Americans | 0.0 /100 | #271 | Tragic 13.4% |
| Immigrants | Bahamas | 0.0 /100 | #272 | Tragic 13.5% |
| Chickasaw | 0.0 /100 | #273 | Tragic 13.5% |
| Immigrants | West Indies | 0.0 /100 | #274 | Tragic 13.5% |
| Barbadians | 0.0 /100 | #275 | Tragic 13.6% |
| Immigrants | Latin America | 0.0 /100 | #276 | Tragic 13.6% |
| Bangladeshis | 0.0 /100 | #277 | Tragic 13.6% |
| Belizeans | 0.0 /100 | #278 | Tragic 13.6% |
| Haitians | 0.0 /100 | #279 | Tragic 13.7% |
Demographics Similar to Scotch-Irish by Male Poverty
In terms of male poverty, the demographic groups most similar to Scotch-Irish are Costa Rican (11.0%, a difference of 0.020%), Colombian (11.0%, a difference of 0.080%), Taiwanese (11.0%, a difference of 0.10%), Immigrants from Malaysia (11.0%, a difference of 0.11%), and Immigrants from Kazakhstan (11.0%, a difference of 0.12%).
| Demographics | Rating | Rank | Male Poverty |
| Guamanians/Chamorros | 67.6 /100 | #150 | Good 11.0% |
| Venezuelans | 67.4 /100 | #151 | Good 11.0% |
| Immigrants | Nepal | 67.3 /100 | #152 | Good 11.0% |
| Immigrants | Bosnia and Herzegovina | 65.2 /100 | #153 | Good 11.0% |
| Immigrants | Kazakhstan | 64.8 /100 | #154 | Good 11.0% |
| Immigrants | Malaysia | 64.7 /100 | #155 | Good 11.0% |
| Costa Ricans | 63.9 /100 | #156 | Good 11.0% |
| Scotch-Irish | 63.7 /100 | #157 | Good 11.0% |
| Colombians | 63.0 /100 | #158 | Good 11.0% |
| Taiwanese | 62.7 /100 | #159 | Good 11.0% |
| Soviet Union | 60.3 /100 | #160 | Good 11.1% |
| Immigrants | Northern Africa | 59.7 /100 | #161 | Average 11.1% |
| Immigrants | Chile | 57.4 /100 | #162 | Average 11.1% |
| Whites/Caucasians | 56.7 /100 | #163 | Average 11.1% |
| Ethiopians | 56.7 /100 | #164 | Average 11.1% |