Immigrants from the Azores vs Pima Family Poverty
COMPARE
Immigrants from the Azores
Pima
Family Poverty
Family Poverty Comparison
Immigrants from the Azores
Pima
10.3%
FAMILY POVERTY
1.4/ 100
METRIC RATING
240th/ 347
METRIC RANK
18.4%
FAMILY POVERTY
0.0/ 100
METRIC RATING
343rd/ 347
METRIC RANK
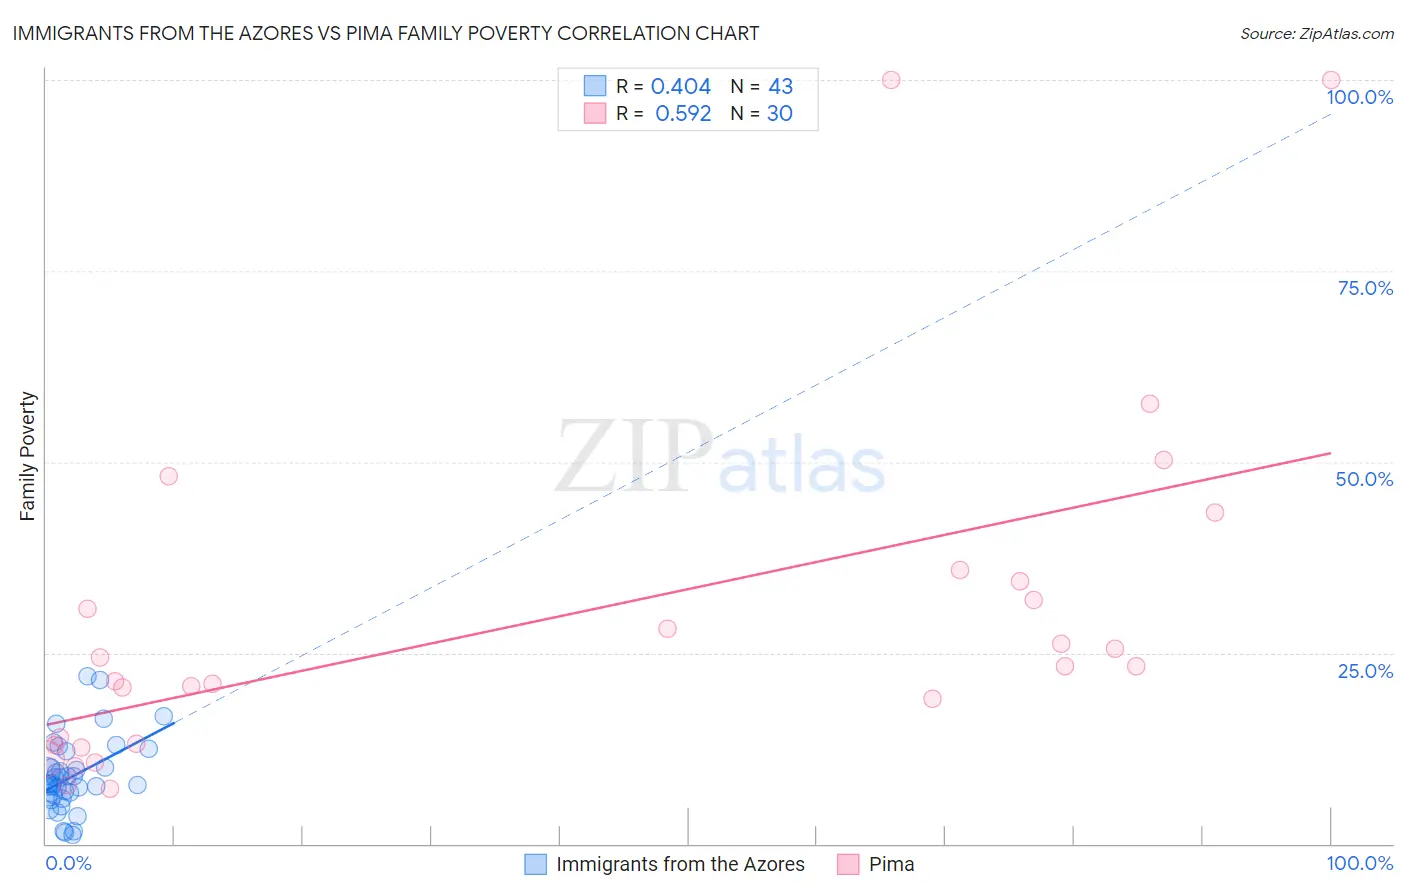
Immigrants from the Azores vs Pima Family Poverty Correlation Chart
The statistical analysis conducted on geographies consisting of 46,193,848 people shows a moderate positive correlation between the proportion of Immigrants from the Azores and poverty level among families in the United States with a correlation coefficient (R) of 0.404 and weighted average of 10.3%. Similarly, the statistical analysis conducted on geographies consisting of 61,531,194 people shows a substantial positive correlation between the proportion of Pima and poverty level among families in the United States with a correlation coefficient (R) of 0.592 and weighted average of 18.4%, a difference of 78.8%.
Family Poverty Correlation Summary
| Measurement | Immigrants from the Azores | Pima |
| Minimum | 1.2% | 7.2% |
| Maximum | 21.9% | 100.0% |
| Range | 20.7% | 92.8% |
| Mean | 8.8% | 29.5% |
| Median | 7.8% | 23.3% |
| Interquartile 25% (IQ1) | 6.1% | 13.0% |
| Interquartile 75% (IQ3) | 10.0% | 34.4% |
| Interquartile Range (IQR) | 3.8% | 21.4% |
| Standard Deviation (Sample) | 4.7% | 23.1% |
| Standard Deviation (Population) | 4.7% | 22.7% |
Similar Demographics by Family Poverty
Demographics Similar to Immigrants from the Azores by Family Poverty
In terms of family poverty, the demographic groups most similar to Immigrants from the Azores are Ghanaian (10.3%, a difference of 0.090%), Potawatomi (10.2%, a difference of 0.31%), French American Indian (10.2%, a difference of 0.35%), Immigrants from Laos (10.2%, a difference of 0.71%), and Alaska Native (10.4%, a difference of 0.95%).
| Demographics | Rating | Rank | Family Poverty |
| Fijians | 2.1 /100 | #233 | Tragic 10.1% |
| Immigrants | Middle Africa | 2.1 /100 | #234 | Tragic 10.1% |
| Nigerians | 2.0 /100 | #235 | Tragic 10.1% |
| Immigrants | Nigeria | 1.9 /100 | #236 | Tragic 10.2% |
| Immigrants | Laos | 1.7 /100 | #237 | Tragic 10.2% |
| French American Indians | 1.5 /100 | #238 | Tragic 10.2% |
| Potawatomi | 1.5 /100 | #239 | Tragic 10.2% |
| Immigrants | Azores | 1.4 /100 | #240 | Tragic 10.3% |
| Ghanaians | 1.3 /100 | #241 | Tragic 10.3% |
| Alaska Natives | 1.0 /100 | #242 | Tragic 10.4% |
| Nepalese | 0.8 /100 | #243 | Tragic 10.4% |
| Cree | 0.7 /100 | #244 | Tragic 10.5% |
| Immigrants | Burma/Myanmar | 0.6 /100 | #245 | Tragic 10.5% |
| Cherokee | 0.5 /100 | #246 | Tragic 10.6% |
| Liberians | 0.4 /100 | #247 | Tragic 10.6% |
Demographics Similar to Pima by Family Poverty
In terms of family poverty, the demographic groups most similar to Pima are Yup'ik (18.7%, a difference of 1.8%), Navajo (18.8%, a difference of 2.4%), Immigrants from Yemen (17.5%, a difference of 5.1%), Lumbee (17.0%, a difference of 8.0%), and Pueblo (17.0%, a difference of 8.1%).
| Demographics | Rating | Rank | Family Poverty |
| Immigrants | Dominican Republic | 0.0 /100 | #333 | Tragic 14.4% |
| Houma | 0.0 /100 | #334 | Tragic 14.6% |
| Apache | 0.0 /100 | #335 | Tragic 14.7% |
| Sioux | 0.0 /100 | #336 | Tragic 15.9% |
| Hopi | 0.0 /100 | #337 | Tragic 15.9% |
| Crow | 0.0 /100 | #338 | Tragic 16.1% |
| Yuman | 0.0 /100 | #339 | Tragic 16.6% |
| Pueblo | 0.0 /100 | #340 | Tragic 17.0% |
| Lumbee | 0.0 /100 | #341 | Tragic 17.0% |
| Immigrants | Yemen | 0.0 /100 | #342 | Tragic 17.5% |
| Pima | 0.0 /100 | #343 | Tragic 18.4% |
| Yup'ik | 0.0 /100 | #344 | Tragic 18.7% |
| Navajo | 0.0 /100 | #345 | Tragic 18.8% |
| Puerto Ricans | 0.0 /100 | #346 | Tragic 20.3% |
| Tohono O'odham | 0.0 /100 | #347 | Tragic 20.4% |