Immigrants from the Azores vs Immigrants from Israel Family Poverty
COMPARE
Immigrants from the Azores
Immigrants from Israel
Family Poverty
Family Poverty Comparison
Immigrants from the Azores
Immigrants from Israel
10.3%
FAMILY POVERTY
1.4/ 100
METRIC RATING
240th/ 347
METRIC RANK
8.2%
FAMILY POVERTY
93.5/ 100
METRIC RATING
115th/ 347
METRIC RANK
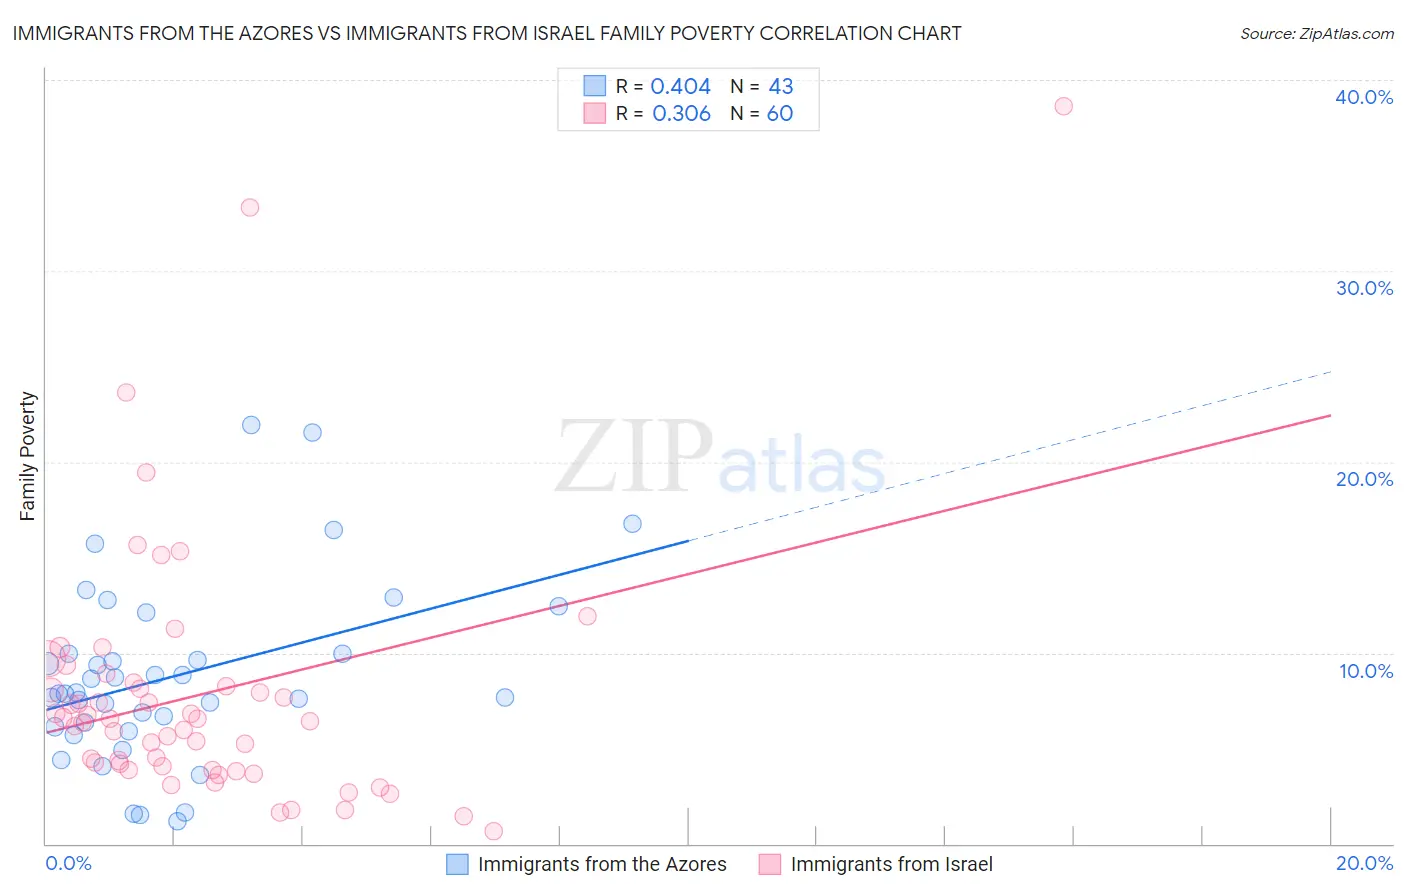
Immigrants from the Azores vs Immigrants from Israel Family Poverty Correlation Chart
The statistical analysis conducted on geographies consisting of 46,193,848 people shows a moderate positive correlation between the proportion of Immigrants from the Azores and poverty level among families in the United States with a correlation coefficient (R) of 0.404 and weighted average of 10.3%. Similarly, the statistical analysis conducted on geographies consisting of 209,738,348 people shows a mild positive correlation between the proportion of Immigrants from Israel and poverty level among families in the United States with a correlation coefficient (R) of 0.306 and weighted average of 8.2%, a difference of 24.9%.
Family Poverty Correlation Summary
| Measurement | Immigrants from the Azores | Immigrants from Israel |
| Minimum | 1.2% | 0.67% |
| Maximum | 21.9% | 38.6% |
| Range | 20.7% | 37.9% |
| Mean | 8.8% | 7.8% |
| Median | 7.8% | 6.5% |
| Interquartile 25% (IQ1) | 6.1% | 4.0% |
| Interquartile 75% (IQ3) | 10.0% | 8.3% |
| Interquartile Range (IQR) | 3.8% | 4.4% |
| Standard Deviation (Sample) | 4.7% | 6.8% |
| Standard Deviation (Population) | 4.7% | 6.7% |
Similar Demographics by Family Poverty
Demographics Similar to Immigrants from the Azores by Family Poverty
In terms of family poverty, the demographic groups most similar to Immigrants from the Azores are Ghanaian (10.3%, a difference of 0.090%), Potawatomi (10.2%, a difference of 0.31%), French American Indian (10.2%, a difference of 0.35%), Immigrants from Laos (10.2%, a difference of 0.71%), and Alaska Native (10.4%, a difference of 0.95%).
| Demographics | Rating | Rank | Family Poverty |
| Fijians | 2.1 /100 | #233 | Tragic 10.1% |
| Immigrants | Middle Africa | 2.1 /100 | #234 | Tragic 10.1% |
| Nigerians | 2.0 /100 | #235 | Tragic 10.1% |
| Immigrants | Nigeria | 1.9 /100 | #236 | Tragic 10.2% |
| Immigrants | Laos | 1.7 /100 | #237 | Tragic 10.2% |
| French American Indians | 1.5 /100 | #238 | Tragic 10.2% |
| Potawatomi | 1.5 /100 | #239 | Tragic 10.2% |
| Immigrants | Azores | 1.4 /100 | #240 | Tragic 10.3% |
| Ghanaians | 1.3 /100 | #241 | Tragic 10.3% |
| Alaska Natives | 1.0 /100 | #242 | Tragic 10.4% |
| Nepalese | 0.8 /100 | #243 | Tragic 10.4% |
| Cree | 0.7 /100 | #244 | Tragic 10.5% |
| Immigrants | Burma/Myanmar | 0.6 /100 | #245 | Tragic 10.5% |
| Cherokee | 0.5 /100 | #246 | Tragic 10.6% |
| Liberians | 0.4 /100 | #247 | Tragic 10.6% |
Demographics Similar to Immigrants from Israel by Family Poverty
In terms of family poverty, the demographic groups most similar to Immigrants from Israel are South African (8.2%, a difference of 0.060%), Immigrants from Russia (8.2%, a difference of 0.13%), Immigrants from Western Europe (8.2%, a difference of 0.32%), Immigrants from Zimbabwe (8.2%, a difference of 0.34%), and French (8.3%, a difference of 0.39%).
| Demographics | Rating | Rank | Family Poverty |
| Basques | 94.9 /100 | #108 | Exceptional 8.1% |
| Jordanians | 94.8 /100 | #109 | Exceptional 8.2% |
| Romanians | 94.7 /100 | #110 | Exceptional 8.2% |
| Taiwanese | 94.6 /100 | #111 | Exceptional 8.2% |
| Immigrants | France | 94.4 /100 | #112 | Exceptional 8.2% |
| Canadians | 94.2 /100 | #113 | Exceptional 8.2% |
| Immigrants | Zimbabwe | 94.0 /100 | #114 | Exceptional 8.2% |
| Immigrants | Israel | 93.5 /100 | #115 | Exceptional 8.2% |
| South Africans | 93.4 /100 | #116 | Exceptional 8.2% |
| Immigrants | Russia | 93.2 /100 | #117 | Exceptional 8.2% |
| Immigrants | Western Europe | 92.9 /100 | #118 | Exceptional 8.2% |
| French | 92.8 /100 | #119 | Exceptional 8.3% |
| Immigrants | Egypt | 91.6 /100 | #120 | Exceptional 8.3% |
| Native Hawaiians | 91.3 /100 | #121 | Exceptional 8.3% |
| Paraguayans | 91.2 /100 | #122 | Exceptional 8.3% |