Immigrants from the Azores vs Pima Poverty
COMPARE
Immigrants from the Azores
Pima
Poverty
Poverty Comparison
Immigrants from the Azores
Pima
13.1%
POVERTY
6.1/ 100
METRIC RATING
210th/ 347
METRIC RANK
21.9%
POVERTY
0.0/ 100
METRIC RATING
343rd/ 347
METRIC RANK
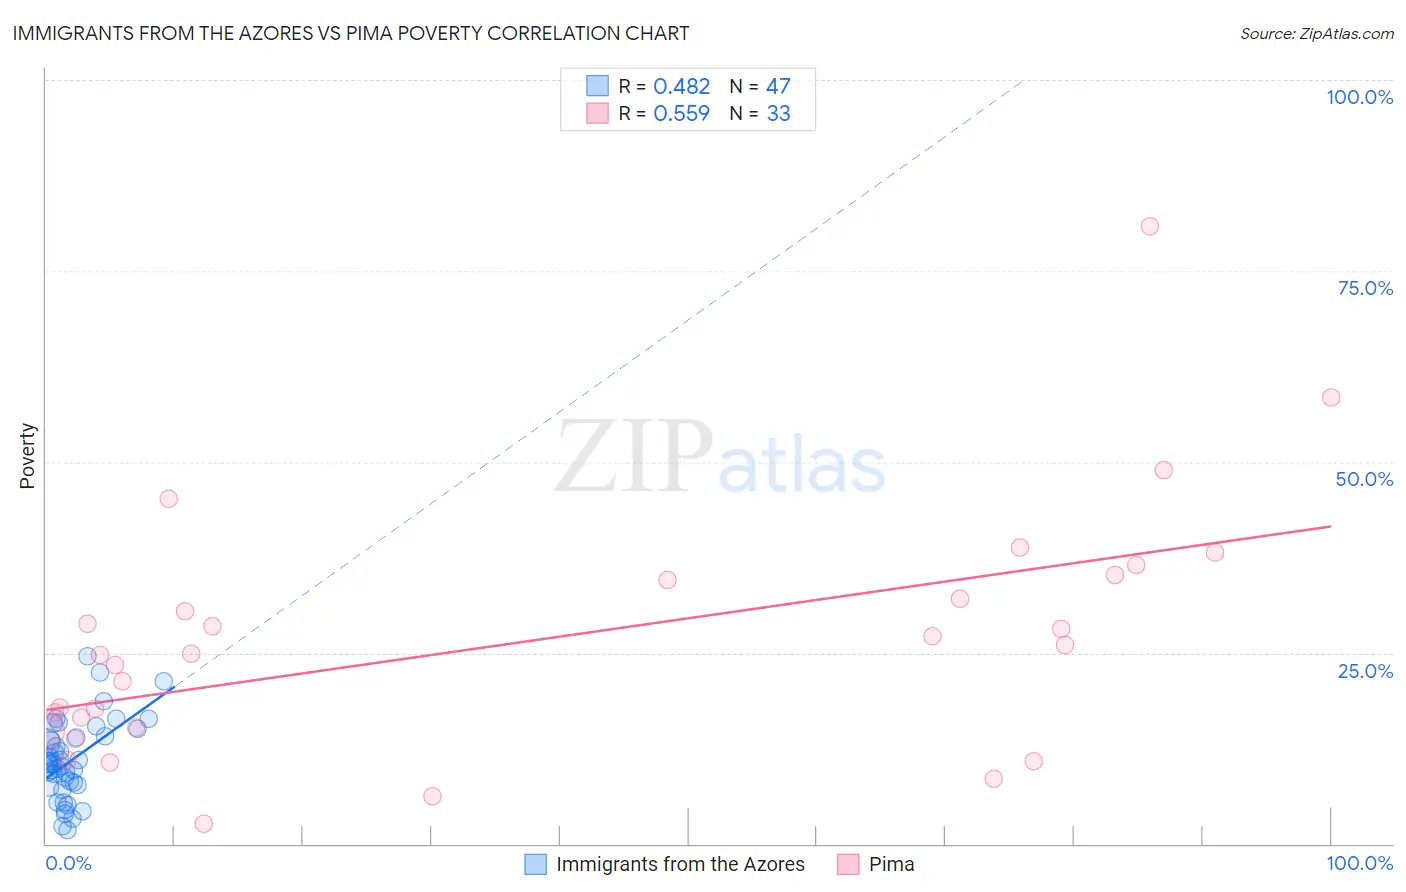
Immigrants from the Azores vs Pima Poverty Correlation Chart
The statistical analysis conducted on geographies consisting of 46,256,915 people shows a moderate positive correlation between the proportion of Immigrants from the Azores and poverty level in the United States with a correlation coefficient (R) of 0.482 and weighted average of 13.1%. Similarly, the statistical analysis conducted on geographies consisting of 61,541,821 people shows a substantial positive correlation between the proportion of Pima and poverty level in the United States with a correlation coefficient (R) of 0.559 and weighted average of 21.9%, a difference of 66.3%.
Poverty Correlation Summary
| Measurement | Immigrants from the Azores | Pima |
| Minimum | 1.8% | 2.5% |
| Maximum | 24.6% | 80.8% |
| Range | 22.8% | 78.3% |
| Mean | 11.0% | 26.5% |
| Median | 10.5% | 24.9% |
| Interquartile 25% (IQ1) | 7.8% | 15.0% |
| Interquartile 75% (IQ3) | 14.1% | 34.9% |
| Interquartile Range (IQR) | 6.3% | 19.8% |
| Standard Deviation (Sample) | 5.1% | 16.1% |
| Standard Deviation (Population) | 5.1% | 15.8% |
Similar Demographics by Poverty
Demographics Similar to Immigrants from the Azores by Poverty
In terms of poverty, the demographic groups most similar to Immigrants from the Azores are Malaysian (13.1%, a difference of 0.030%), Ugandan (13.1%, a difference of 0.060%), Panamanian (13.1%, a difference of 0.21%), Immigrants from Eastern Africa (13.1%, a difference of 0.34%), and Moroccan (13.2%, a difference of 0.35%).
| Demographics | Rating | Rank | Poverty |
| Hmong | 15.0 /100 | #203 | Poor 12.8% |
| Immigrants | Western Asia | 14.1 /100 | #204 | Poor 12.9% |
| Tsimshian | 9.2 /100 | #205 | Tragic 13.0% |
| Immigrants | Eastern Africa | 7.0 /100 | #206 | Tragic 13.1% |
| Panamanians | 6.6 /100 | #207 | Tragic 13.1% |
| Ugandans | 6.2 /100 | #208 | Tragic 13.1% |
| Malaysians | 6.1 /100 | #209 | Tragic 13.1% |
| Immigrants | Azores | 6.1 /100 | #210 | Tragic 13.1% |
| Moroccans | 5.2 /100 | #211 | Tragic 13.2% |
| Immigrants | Immigrants | 4.3 /100 | #212 | Tragic 13.2% |
| Immigrants | Panama | 4.1 /100 | #213 | Tragic 13.3% |
| Bermudans | 3.7 /100 | #214 | Tragic 13.3% |
| Japanese | 3.3 /100 | #215 | Tragic 13.3% |
| Immigrants | Nonimmigrants | 3.3 /100 | #216 | Tragic 13.3% |
| Immigrants | Uzbekistan | 3.2 /100 | #217 | Tragic 13.3% |
Demographics Similar to Pima by Poverty
In terms of poverty, the demographic groups most similar to Pima are Lumbee (21.9%, a difference of 0.26%), Immigrants from Yemen (21.5%, a difference of 1.6%), Hopi (20.8%, a difference of 4.8%), Yup'ik (20.8%, a difference of 5.0%), and Navajo (23.1%, a difference of 5.6%).
| Demographics | Rating | Rank | Poverty |
| Houma | 0.0 /100 | #333 | Tragic 18.4% |
| Apache | 0.0 /100 | #334 | Tragic 18.4% |
| Cheyenne | 0.0 /100 | #335 | Tragic 18.9% |
| Pueblo | 0.0 /100 | #336 | Tragic 19.4% |
| Sioux | 0.0 /100 | #337 | Tragic 19.8% |
| Yuman | 0.0 /100 | #338 | Tragic 20.2% |
| Crow | 0.0 /100 | #339 | Tragic 20.7% |
| Yup'ik | 0.0 /100 | #340 | Tragic 20.8% |
| Hopi | 0.0 /100 | #341 | Tragic 20.8% |
| Immigrants | Yemen | 0.0 /100 | #342 | Tragic 21.5% |
| Pima | 0.0 /100 | #343 | Tragic 21.9% |
| Lumbee | 0.0 /100 | #344 | Tragic 21.9% |
| Navajo | 0.0 /100 | #345 | Tragic 23.1% |
| Puerto Ricans | 0.0 /100 | #346 | Tragic 23.7% |
| Tohono O'odham | 0.0 /100 | #347 | Tragic 24.4% |