French vs Pima Family Poverty
COMPARE
French
Pima
Family Poverty
Family Poverty Comparison
French
Pima
8.3%
FAMILY POVERTY
92.8/ 100
METRIC RATING
119th/ 347
METRIC RANK
18.4%
FAMILY POVERTY
0.0/ 100
METRIC RATING
343rd/ 347
METRIC RANK
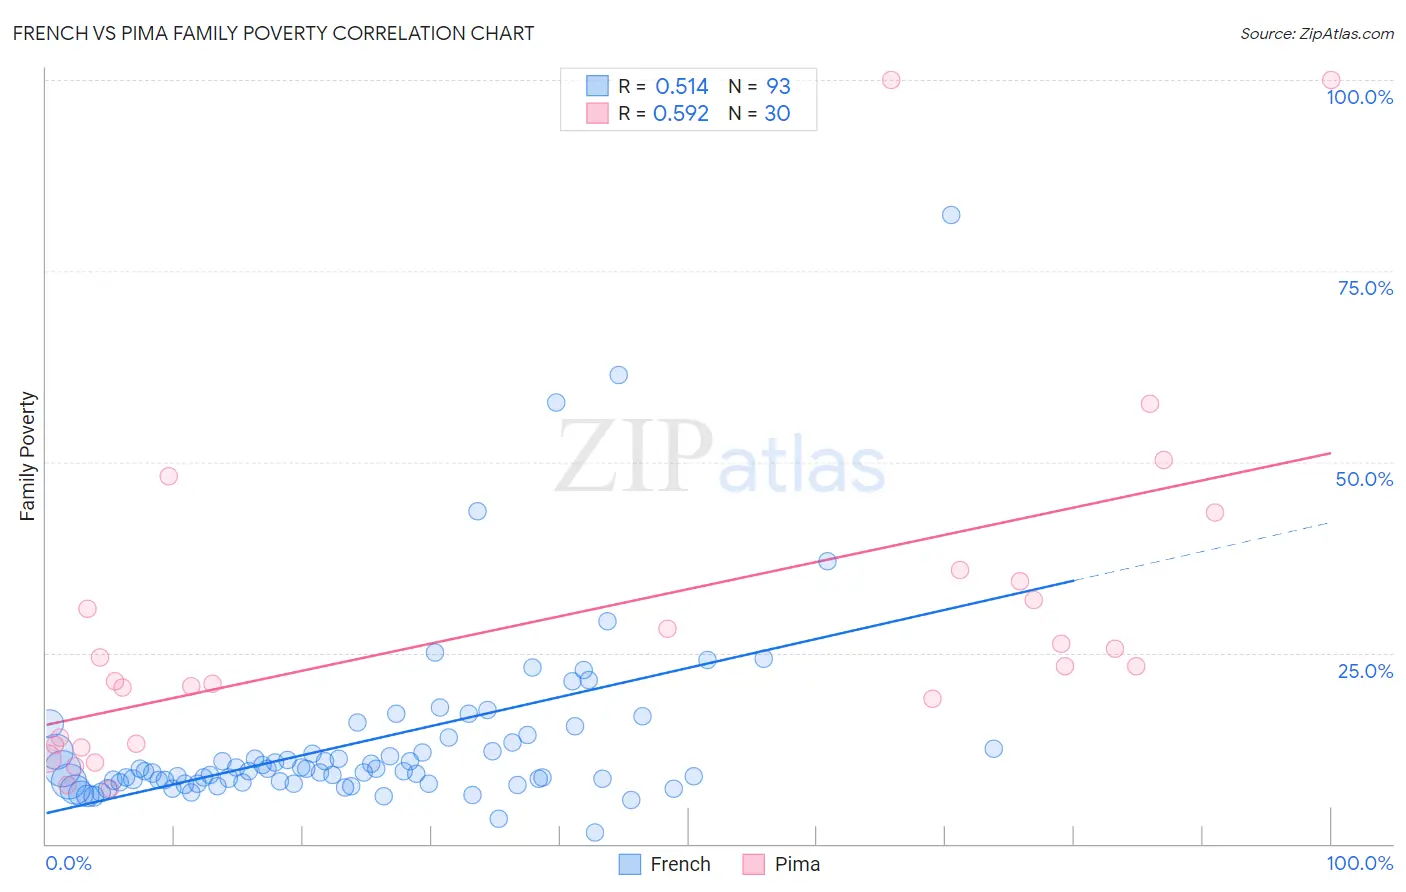
French vs Pima Family Poverty Correlation Chart
The statistical analysis conducted on geographies consisting of 567,554,801 people shows a substantial positive correlation between the proportion of French and poverty level among families in the United States with a correlation coefficient (R) of 0.514 and weighted average of 8.3%. Similarly, the statistical analysis conducted on geographies consisting of 61,531,194 people shows a substantial positive correlation between the proportion of Pima and poverty level among families in the United States with a correlation coefficient (R) of 0.592 and weighted average of 18.4%, a difference of 122.5%.
Family Poverty Correlation Summary
| Measurement | French | Pima |
| Minimum | 1.5% | 7.2% |
| Maximum | 82.4% | 100.0% |
| Range | 80.9% | 92.8% |
| Mean | 13.4% | 29.5% |
| Median | 9.6% | 23.3% |
| Interquartile 25% (IQ1) | 8.0% | 13.0% |
| Interquartile 75% (IQ3) | 13.6% | 34.4% |
| Interquartile Range (IQR) | 5.6% | 21.4% |
| Standard Deviation (Sample) | 12.0% | 23.1% |
| Standard Deviation (Population) | 11.9% | 22.7% |
Similar Demographics by Family Poverty
Demographics Similar to French by Family Poverty
In terms of family poverty, the demographic groups most similar to French are Immigrants from Western Europe (8.2%, a difference of 0.070%), Immigrants from Russia (8.2%, a difference of 0.26%), South African (8.2%, a difference of 0.33%), Immigrants from Israel (8.2%, a difference of 0.39%), and Immigrants from Egypt (8.3%, a difference of 0.56%).
| Demographics | Rating | Rank | Family Poverty |
| Immigrants | France | 94.4 /100 | #112 | Exceptional 8.2% |
| Canadians | 94.2 /100 | #113 | Exceptional 8.2% |
| Immigrants | Zimbabwe | 94.0 /100 | #114 | Exceptional 8.2% |
| Immigrants | Israel | 93.5 /100 | #115 | Exceptional 8.2% |
| South Africans | 93.4 /100 | #116 | Exceptional 8.2% |
| Immigrants | Russia | 93.2 /100 | #117 | Exceptional 8.2% |
| Immigrants | Western Europe | 92.9 /100 | #118 | Exceptional 8.2% |
| French | 92.8 /100 | #119 | Exceptional 8.3% |
| Immigrants | Egypt | 91.6 /100 | #120 | Exceptional 8.3% |
| Native Hawaiians | 91.3 /100 | #121 | Exceptional 8.3% |
| Paraguayans | 91.2 /100 | #122 | Exceptional 8.3% |
| Palestinians | 91.1 /100 | #123 | Exceptional 8.3% |
| Soviet Union | 90.8 /100 | #124 | Exceptional 8.3% |
| Pakistanis | 90.8 /100 | #125 | Exceptional 8.3% |
| Icelanders | 90.3 /100 | #126 | Exceptional 8.3% |
Demographics Similar to Pima by Family Poverty
In terms of family poverty, the demographic groups most similar to Pima are Yup'ik (18.7%, a difference of 1.8%), Navajo (18.8%, a difference of 2.4%), Immigrants from Yemen (17.5%, a difference of 5.1%), Lumbee (17.0%, a difference of 8.0%), and Pueblo (17.0%, a difference of 8.1%).
| Demographics | Rating | Rank | Family Poverty |
| Immigrants | Dominican Republic | 0.0 /100 | #333 | Tragic 14.4% |
| Houma | 0.0 /100 | #334 | Tragic 14.6% |
| Apache | 0.0 /100 | #335 | Tragic 14.7% |
| Sioux | 0.0 /100 | #336 | Tragic 15.9% |
| Hopi | 0.0 /100 | #337 | Tragic 15.9% |
| Crow | 0.0 /100 | #338 | Tragic 16.1% |
| Yuman | 0.0 /100 | #339 | Tragic 16.6% |
| Pueblo | 0.0 /100 | #340 | Tragic 17.0% |
| Lumbee | 0.0 /100 | #341 | Tragic 17.0% |
| Immigrants | Yemen | 0.0 /100 | #342 | Tragic 17.5% |
| Pima | 0.0 /100 | #343 | Tragic 18.4% |
| Yup'ik | 0.0 /100 | #344 | Tragic 18.7% |
| Navajo | 0.0 /100 | #345 | Tragic 18.8% |
| Puerto Ricans | 0.0 /100 | #346 | Tragic 20.3% |
| Tohono O'odham | 0.0 /100 | #347 | Tragic 20.4% |