Immigrants from Austria vs Comanche Female Poverty
COMPARE
Immigrants from Austria
Comanche
Female Poverty
Female Poverty Comparison
Immigrants from Austria
Comanche
12.0%
FEMALE POVERTY
98.7/ 100
METRIC RATING
53rd/ 347
METRIC RANK
16.2%
FEMALE POVERTY
0.0/ 100
METRIC RATING
285th/ 347
METRIC RANK
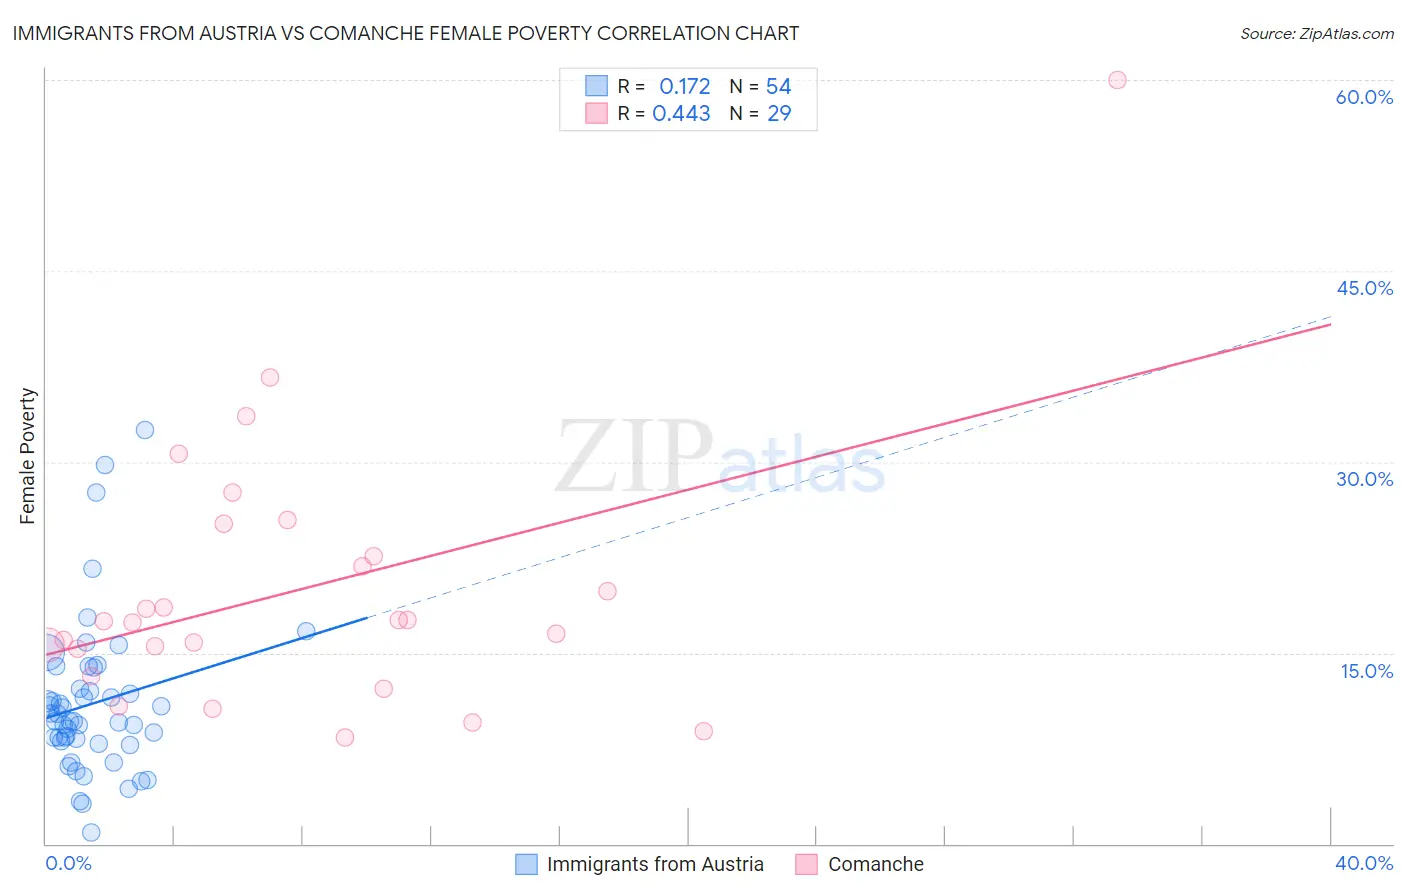
Immigrants from Austria vs Comanche Female Poverty Correlation Chart
The statistical analysis conducted on geographies consisting of 167,923,164 people shows a poor positive correlation between the proportion of Immigrants from Austria and poverty level among females in the United States with a correlation coefficient (R) of 0.172 and weighted average of 12.0%. Similarly, the statistical analysis conducted on geographies consisting of 109,749,855 people shows a moderate positive correlation between the proportion of Comanche and poverty level among females in the United States with a correlation coefficient (R) of 0.443 and weighted average of 16.2%, a difference of 34.4%.
Female Poverty Correlation Summary
| Measurement | Immigrants from Austria | Comanche |
| Minimum | 0.92% | 8.4% |
| Maximum | 32.5% | 60.0% |
| Range | 31.6% | 51.6% |
| Mean | 11.0% | 20.0% |
| Median | 9.6% | 17.4% |
| Interquartile 25% (IQ1) | 8.0% | 14.3% |
| Interquartile 75% (IQ3) | 12.2% | 23.9% |
| Interquartile Range (IQR) | 4.2% | 9.6% |
| Standard Deviation (Sample) | 6.0% | 10.5% |
| Standard Deviation (Population) | 6.0% | 10.3% |
Similar Demographics by Female Poverty
Demographics Similar to Immigrants from Austria by Female Poverty
In terms of female poverty, the demographic groups most similar to Immigrants from Austria are Immigrants from Croatia (12.0%, a difference of 0.010%), Immigrants from Philippines (12.1%, a difference of 0.14%), Immigrants from Bulgaria (12.0%, a difference of 0.31%), Immigrants from Sri Lanka (12.1%, a difference of 0.50%), and Slovene (12.0%, a difference of 0.53%).
| Demographics | Rating | Rank | Female Poverty |
| Turks | 99.2 /100 | #46 | Exceptional 11.9% |
| Asians | 99.1 /100 | #47 | Exceptional 11.9% |
| Immigrants | Japan | 99.0 /100 | #48 | Exceptional 11.9% |
| Immigrants | Romania | 99.0 /100 | #49 | Exceptional 12.0% |
| Slovenes | 98.9 /100 | #50 | Exceptional 12.0% |
| Immigrants | Bulgaria | 98.9 /100 | #51 | Exceptional 12.0% |
| Immigrants | Croatia | 98.7 /100 | #52 | Exceptional 12.0% |
| Immigrants | Austria | 98.7 /100 | #53 | Exceptional 12.0% |
| Immigrants | Philippines | 98.7 /100 | #54 | Exceptional 12.1% |
| Immigrants | Sri Lanka | 98.5 /100 | #55 | Exceptional 12.1% |
| Estonians | 98.3 /100 | #56 | Exceptional 12.1% |
| Immigrants | Serbia | 98.3 /100 | #57 | Exceptional 12.1% |
| Scandinavians | 98.2 /100 | #58 | Exceptional 12.1% |
| Immigrants | Europe | 98.2 /100 | #59 | Exceptional 12.1% |
| Immigrants | Australia | 98.1 /100 | #60 | Exceptional 12.2% |
Demographics Similar to Comanche by Female Poverty
In terms of female poverty, the demographic groups most similar to Comanche are Spanish American (16.2%, a difference of 0.080%), Immigrants from Cuba (16.1%, a difference of 0.13%), Immigrants from Haiti (16.1%, a difference of 0.21%), West Indian (16.1%, a difference of 0.36%), and Vietnamese (16.1%, a difference of 0.38%).
| Demographics | Rating | Rank | Female Poverty |
| Immigrants | West Indies | 0.0 /100 | #278 | Tragic 16.1% |
| Immigrants | Bahamas | 0.0 /100 | #279 | Tragic 16.1% |
| Vietnamese | 0.0 /100 | #280 | Tragic 16.1% |
| West Indians | 0.0 /100 | #281 | Tragic 16.1% |
| Immigrants | Haiti | 0.0 /100 | #282 | Tragic 16.1% |
| Immigrants | Cuba | 0.0 /100 | #283 | Tragic 16.1% |
| Spanish Americans | 0.0 /100 | #284 | Tragic 16.2% |
| Comanche | 0.0 /100 | #285 | Tragic 16.2% |
| Inupiat | 0.0 /100 | #286 | Tragic 16.2% |
| Immigrants | Belize | 0.0 /100 | #287 | Tragic 16.3% |
| Indonesians | 0.0 /100 | #288 | Tragic 16.4% |
| Blackfeet | 0.0 /100 | #289 | Tragic 16.4% |
| Immigrants | Bangladesh | 0.0 /100 | #290 | Tragic 16.4% |
| Yaqui | 0.0 /100 | #291 | Tragic 16.4% |
| Immigrants | Zaire | 0.0 /100 | #292 | Tragic 16.4% |