Immigrants from Australia vs Peruvian Average Family Size
COMPARE
Immigrants from Australia
Peruvian
Average Family Size
Average Family Size Comparison
Immigrants from Australia
Peruvians
3.13
AVERAGE FAMILY SIZE
0.1/ 100
METRIC RATING
312th/ 347
METRIC RANK
3.30
AVERAGE FAMILY SIZE
99.2/ 100
METRIC RATING
93rd/ 347
METRIC RANK
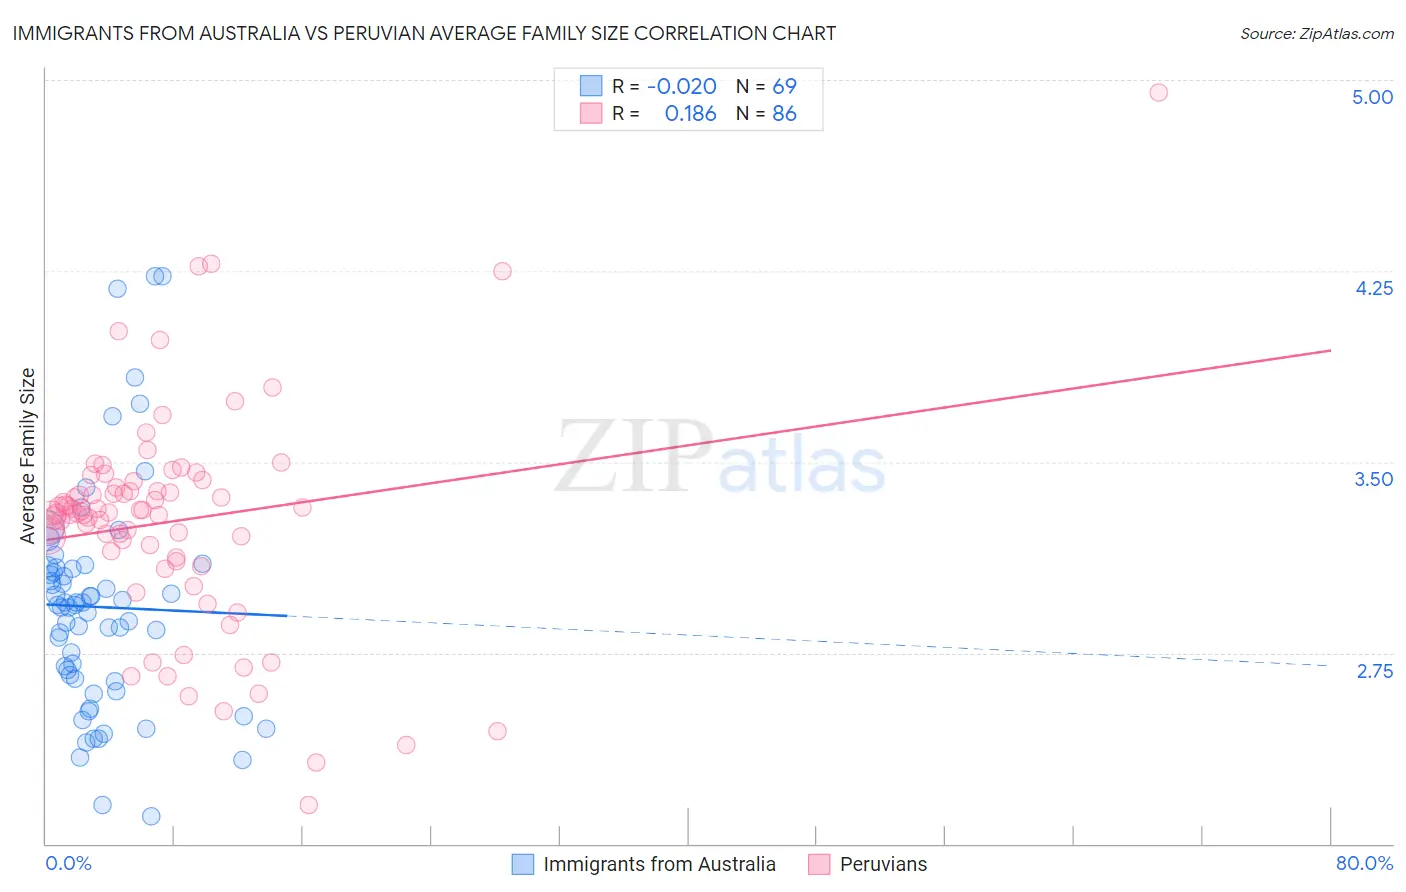
Immigrants from Australia vs Peruvian Average Family Size Correlation Chart
The statistical analysis conducted on geographies consisting of 227,146,773 people shows no correlation between the proportion of Immigrants from Australia and average family size in the United States with a correlation coefficient (R) of -0.020 and weighted average of 3.13. Similarly, the statistical analysis conducted on geographies consisting of 362,986,655 people shows a poor positive correlation between the proportion of Peruvians and average family size in the United States with a correlation coefficient (R) of 0.186 and weighted average of 3.30, a difference of 5.5%.
Average Family Size Correlation Summary
| Measurement | Immigrants from Australia | Peruvian |
| Minimum | 2.11 | 2.15 |
| Maximum | 4.23 | 4.95 |
| Range | 2.12 | 2.80 |
| Mean | 2.93 | 3.27 |
| Median | 2.94 | 3.30 |
| Interquartile 25% (IQ1) | 2.64 | 3.13 |
| Interquartile 75% (IQ3) | 3.08 | 3.40 |
| Interquartile Range (IQR) | 0.44 | 0.27 |
| Standard Deviation (Sample) | 0.44 | 0.43 |
| Standard Deviation (Population) | 0.44 | 0.43 |
Similar Demographics by Average Family Size
Demographics Similar to Immigrants from Australia by Average Family Size
In terms of average family size, the demographic groups most similar to Immigrants from Australia are Bulgarian (3.13, a difference of 0.0%), Immigrants from Northern Europe (3.13, a difference of 0.020%), Russian (3.12, a difference of 0.050%), Czechoslovakian (3.13, a difference of 0.060%), and Immigrants from Scotland (3.12, a difference of 0.060%).
| Demographics | Rating | Rank | Average Family Size |
| Australians | 0.1 /100 | #305 | Tragic 3.13 |
| Immigrants | Ireland | 0.1 /100 | #306 | Tragic 3.13 |
| Immigrants | Serbia | 0.1 /100 | #307 | Tragic 3.13 |
| Slavs | 0.1 /100 | #308 | Tragic 3.13 |
| Northern Europeans | 0.1 /100 | #309 | Tragic 3.13 |
| Czechoslovakians | 0.1 /100 | #310 | Tragic 3.13 |
| Immigrants | Northern Europe | 0.1 /100 | #311 | Tragic 3.13 |
| Immigrants | Australia | 0.1 /100 | #312 | Tragic 3.13 |
| Bulgarians | 0.1 /100 | #313 | Tragic 3.13 |
| Russians | 0.1 /100 | #314 | Tragic 3.12 |
| Immigrants | Scotland | 0.1 /100 | #315 | Tragic 3.12 |
| Serbians | 0.1 /100 | #316 | Tragic 3.12 |
| Italians | 0.1 /100 | #317 | Tragic 3.12 |
| Eastern Europeans | 0.1 /100 | #318 | Tragic 3.12 |
| Welsh | 0.1 /100 | #319 | Tragic 3.12 |
Demographics Similar to Peruvians by Average Family Size
In terms of average family size, the demographic groups most similar to Peruvians are Immigrants from Cameroon (3.30, a difference of 0.010%), Immigrants from Pakistan (3.30, a difference of 0.020%), Sierra Leonean (3.30, a difference of 0.10%), Immigrants from Lebanon (3.30, a difference of 0.11%), and Menominee (3.30, a difference of 0.17%).
| Demographics | Rating | Rank | Average Family Size |
| Jamaicans | 99.7 /100 | #86 | Exceptional 3.31 |
| Immigrants | Peru | 99.7 /100 | #87 | Exceptional 3.31 |
| Immigrants | Bolivia | 99.6 /100 | #88 | Exceptional 3.31 |
| Malaysians | 99.6 /100 | #89 | Exceptional 3.31 |
| Menominee | 99.4 /100 | #90 | Exceptional 3.30 |
| Immigrants | Pakistan | 99.2 /100 | #91 | Exceptional 3.30 |
| Immigrants | Cameroon | 99.2 /100 | #92 | Exceptional 3.30 |
| Peruvians | 99.2 /100 | #93 | Exceptional 3.30 |
| Sierra Leoneans | 99.0 /100 | #94 | Exceptional 3.30 |
| Immigrants | Lebanon | 99.0 /100 | #95 | Exceptional 3.30 |
| U.S. Virgin Islanders | 98.8 /100 | #96 | Exceptional 3.29 |
| Immigrants | Oceania | 98.7 /100 | #97 | Exceptional 3.29 |
| Barbadians | 98.6 /100 | #98 | Exceptional 3.29 |
| Nigerians | 98.6 /100 | #99 | Exceptional 3.29 |
| Guamanians/Chamorros | 98.6 /100 | #100 | Exceptional 3.29 |