Immigrants from Armenia vs Lumbee Female Unemployment
COMPARE
Immigrants from Armenia
Lumbee
Female Unemployment
Female Unemployment Comparison
Immigrants from Armenia
Lumbee
7.1%
FEMALE UNEMPLOYMENT
0.0/ 100
METRIC RATING
334th/ 347
METRIC RANK
5.9%
FEMALE UNEMPLOYMENT
0.0/ 100
METRIC RATING
272nd/ 347
METRIC RANK
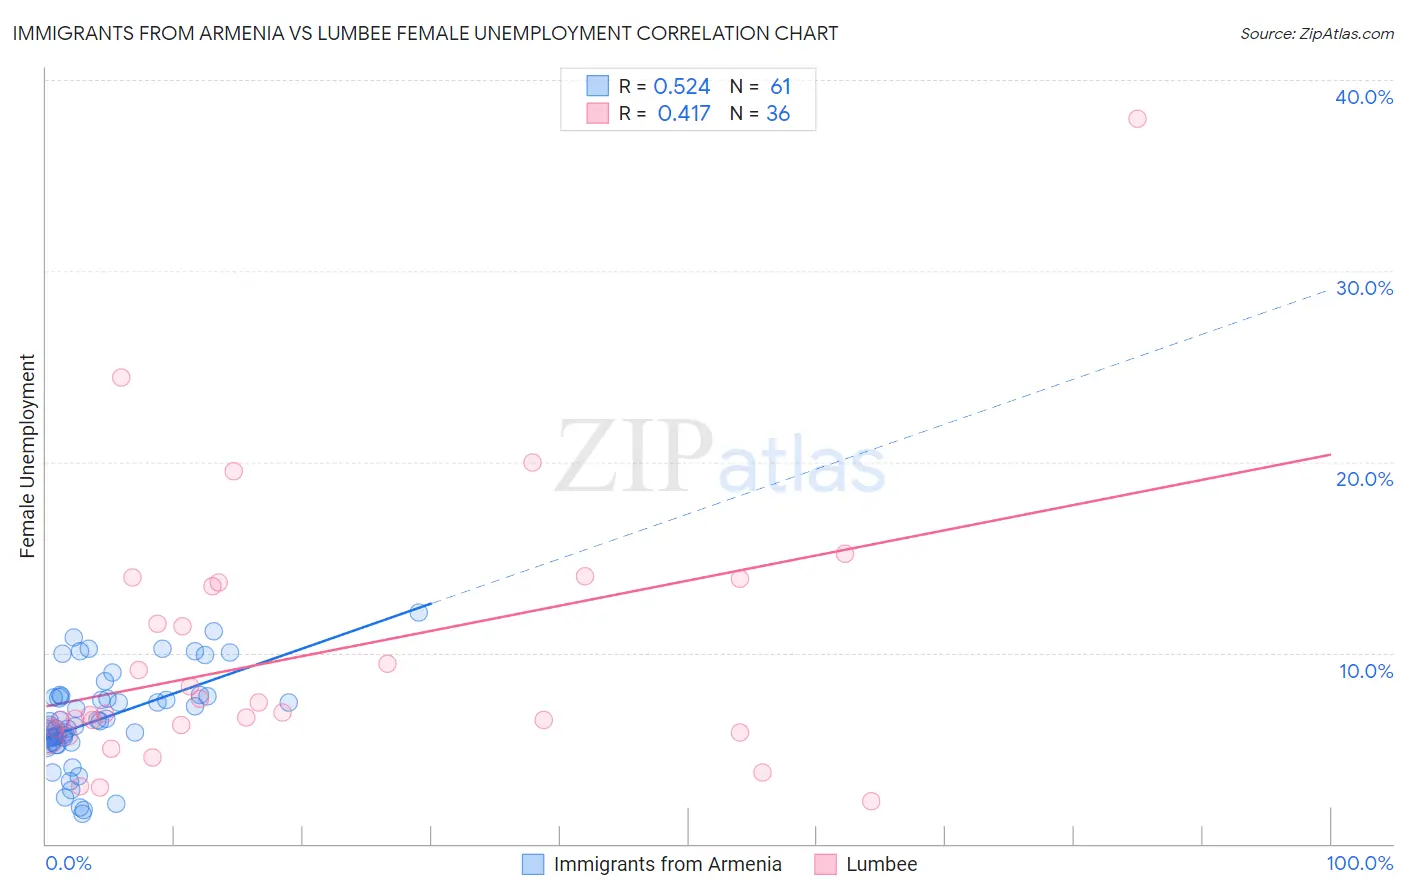
Immigrants from Armenia vs Lumbee Female Unemployment Correlation Chart
The statistical analysis conducted on geographies consisting of 97,677,717 people shows a substantial positive correlation between the proportion of Immigrants from Armenia and unemploymnet rate among females in the United States with a correlation coefficient (R) of 0.524 and weighted average of 7.1%. Similarly, the statistical analysis conducted on geographies consisting of 92,134,947 people shows a moderate positive correlation between the proportion of Lumbee and unemploymnet rate among females in the United States with a correlation coefficient (R) of 0.417 and weighted average of 5.9%, a difference of 19.0%.
Female Unemployment Correlation Summary
| Measurement | Immigrants from Armenia | Lumbee |
| Minimum | 1.6% | 2.2% |
| Maximum | 12.1% | 38.0% |
| Range | 10.5% | 35.8% |
| Mean | 6.6% | 9.8% |
| Median | 6.4% | 6.9% |
| Interquartile 25% (IQ1) | 5.4% | 5.9% |
| Interquartile 75% (IQ3) | 7.7% | 13.6% |
| Interquartile Range (IQR) | 2.3% | 7.7% |
| Standard Deviation (Sample) | 2.4% | 7.0% |
| Standard Deviation (Population) | 2.4% | 6.9% |
Similar Demographics by Female Unemployment
Demographics Similar to Immigrants from Armenia by Female Unemployment
In terms of female unemployment, the demographic groups most similar to Immigrants from Armenia are Menominee (7.0%, a difference of 0.41%), Sioux (7.0%, a difference of 0.44%), Dominican (7.2%, a difference of 1.4%), Immigrants from Dominican Republic (7.2%, a difference of 2.1%), and Navajo (7.3%, a difference of 3.0%).
| Demographics | Rating | Rank | Female Unemployment |
| Alaska Natives | 0.0 /100 | #327 | Tragic 6.6% |
| Guyanese | 0.0 /100 | #328 | Tragic 6.7% |
| Immigrants | Guyana | 0.0 /100 | #329 | Tragic 6.7% |
| Yakama | 0.0 /100 | #330 | Tragic 6.7% |
| Paiute | 0.0 /100 | #331 | Tragic 6.8% |
| Sioux | 0.0 /100 | #332 | Tragic 7.0% |
| Menominee | 0.0 /100 | #333 | Tragic 7.0% |
| Immigrants | Armenia | 0.0 /100 | #334 | Tragic 7.1% |
| Dominicans | 0.0 /100 | #335 | Tragic 7.2% |
| Immigrants | Dominican Republic | 0.0 /100 | #336 | Tragic 7.2% |
| Navajo | 0.0 /100 | #337 | Tragic 7.3% |
| Tohono O'odham | 0.0 /100 | #338 | Tragic 7.7% |
| Immigrants | Yemen | 0.0 /100 | #339 | Tragic 7.8% |
| Hopi | 0.0 /100 | #340 | Tragic 8.1% |
| Inupiat | 0.0 /100 | #341 | Tragic 8.2% |
Demographics Similar to Lumbee by Female Unemployment
In terms of female unemployment, the demographic groups most similar to Lumbee are Ghanaian (5.9%, a difference of 0.010%), African (5.9%, a difference of 0.090%), Central American (5.9%, a difference of 0.19%), Immigrants from Honduras (5.9%, a difference of 0.29%), and Senegalese (6.0%, a difference of 0.58%).
| Demographics | Rating | Rank | Female Unemployment |
| Blackfeet | 0.0 /100 | #265 | Tragic 5.9% |
| Cape Verdeans | 0.0 /100 | #266 | Tragic 5.9% |
| Nepalese | 0.0 /100 | #267 | Tragic 5.9% |
| Hondurans | 0.0 /100 | #268 | Tragic 5.9% |
| Immigrants | Western Africa | 0.0 /100 | #269 | Tragic 5.9% |
| Immigrants | Honduras | 0.0 /100 | #270 | Tragic 5.9% |
| Central Americans | 0.0 /100 | #271 | Tragic 5.9% |
| Lumbee | 0.0 /100 | #272 | Tragic 5.9% |
| Ghanaians | 0.0 /100 | #273 | Tragic 5.9% |
| Africans | 0.0 /100 | #274 | Tragic 5.9% |
| Senegalese | 0.0 /100 | #275 | Tragic 6.0% |
| Bahamians | 0.0 /100 | #276 | Tragic 6.0% |
| Immigrants | Ghana | 0.0 /100 | #277 | Tragic 6.0% |
| Yaqui | 0.0 /100 | #278 | Tragic 6.0% |
| Armenians | 0.0 /100 | #279 | Tragic 6.0% |