Immigrants from Somalia vs Trinidadian and Tobagonian Receiving Food Stamps
COMPARE
Immigrants from Somalia
Trinidadian and Tobagonian
Receiving Food Stamps
Receiving Food Stamps Comparison
Immigrants from Somalia
Trinidadians and Tobagonians
13.7%
RECEIVING FOOD STAMPS
0.9/ 100
METRIC RATING
245th/ 347
METRIC RANK
16.0%
RECEIVING FOOD STAMPS
0.0/ 100
METRIC RATING
301st/ 347
METRIC RANK
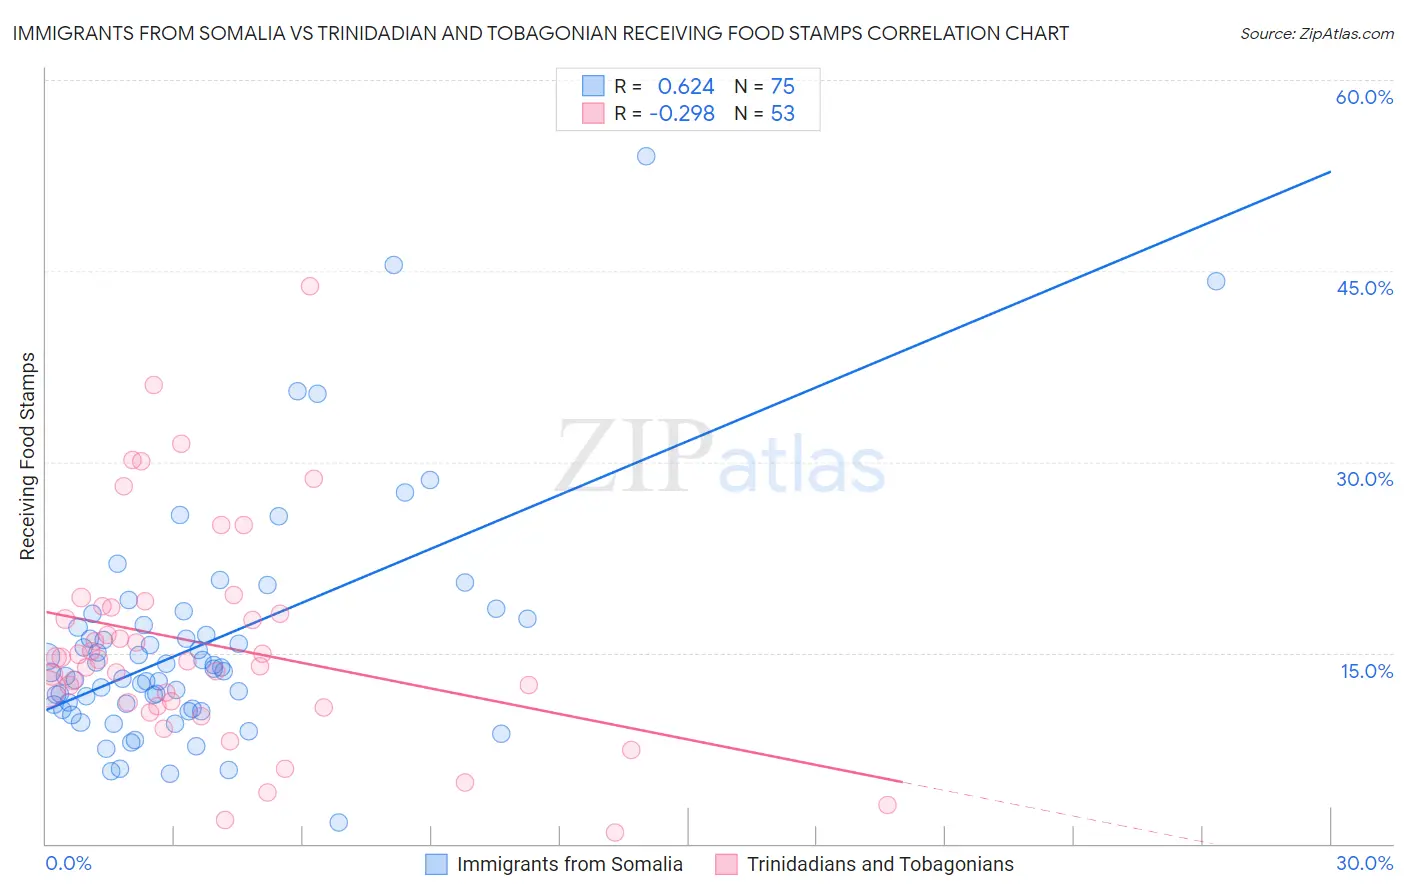
Immigrants from Somalia vs Trinidadian and Tobagonian Receiving Food Stamps Correlation Chart
The statistical analysis conducted on geographies consisting of 92,085,024 people shows a significant positive correlation between the proportion of Immigrants from Somalia and percentage of population receiving government assistance and/or food stamps in the United States with a correlation coefficient (R) of 0.624 and weighted average of 13.7%. Similarly, the statistical analysis conducted on geographies consisting of 219,495,740 people shows a weak negative correlation between the proportion of Trinidadians and Tobagonians and percentage of population receiving government assistance and/or food stamps in the United States with a correlation coefficient (R) of -0.298 and weighted average of 16.0%, a difference of 16.7%.
Receiving Food Stamps Correlation Summary
| Measurement | Immigrants from Somalia | Trinidadian and Tobagonian |
| Minimum | 1.7% | 0.90% |
| Maximum | 54.0% | 43.8% |
| Range | 52.3% | 42.9% |
| Mean | 15.6% | 15.7% |
| Median | 13.6% | 14.5% |
| Interquartile 25% (IQ1) | 10.6% | 10.9% |
| Interquartile 75% (IQ3) | 17.2% | 18.6% |
| Interquartile Range (IQR) | 6.6% | 7.7% |
| Standard Deviation (Sample) | 9.1% | 8.5% |
| Standard Deviation (Population) | 9.0% | 8.4% |
Similar Demographics by Receiving Food Stamps
Demographics Similar to Immigrants from Somalia by Receiving Food Stamps
In terms of receiving food stamps, the demographic groups most similar to Immigrants from Somalia are Cajun (13.7%, a difference of 0.040%), Somali (13.7%, a difference of 0.20%), Cree (13.7%, a difference of 0.24%), Immigrants from Panama (13.6%, a difference of 0.39%), and Mexican American Indian (13.8%, a difference of 0.51%).
| Demographics | Rating | Rank | Receiving Food Stamps |
| French American Indians | 1.4 /100 | #238 | Tragic 13.5% |
| Immigrants | Micronesia | 1.3 /100 | #239 | Tragic 13.5% |
| Iroquois | 1.2 /100 | #240 | Tragic 13.5% |
| Choctaw | 1.0 /100 | #241 | Tragic 13.6% |
| Immigrants | Panama | 1.0 /100 | #242 | Tragic 13.6% |
| Somalis | 0.9 /100 | #243 | Tragic 13.7% |
| Cajuns | 0.9 /100 | #244 | Tragic 13.7% |
| Immigrants | Somalia | 0.9 /100 | #245 | Tragic 13.7% |
| Cree | 0.8 /100 | #246 | Tragic 13.7% |
| Mexican American Indians | 0.7 /100 | #247 | Tragic 13.8% |
| Immigrants | Laos | 0.7 /100 | #248 | Tragic 13.8% |
| Indonesians | 0.6 /100 | #249 | Tragic 13.9% |
| Immigrants | Cambodia | 0.5 /100 | #250 | Tragic 13.9% |
| Yaqui | 0.5 /100 | #251 | Tragic 13.9% |
| Ghanaians | 0.5 /100 | #252 | Tragic 14.0% |
Demographics Similar to Trinidadians and Tobagonians by Receiving Food Stamps
In terms of receiving food stamps, the demographic groups most similar to Trinidadians and Tobagonians are Immigrants from Bangladesh (15.9%, a difference of 0.45%), Hispanic or Latino (15.8%, a difference of 0.89%), Immigrants from West Indies (16.1%, a difference of 0.94%), Nicaraguan (16.1%, a difference of 1.0%), and Immigrants from Trinidad and Tobago (15.8%, a difference of 1.2%).
| Demographics | Rating | Rank | Receiving Food Stamps |
| Immigrants | Latin America | 0.0 /100 | #294 | Tragic 15.7% |
| Immigrants | Honduras | 0.0 /100 | #295 | Tragic 15.7% |
| Tsimshian | 0.0 /100 | #296 | Tragic 15.7% |
| Immigrants | Bahamas | 0.0 /100 | #297 | Tragic 15.8% |
| Immigrants | Trinidad and Tobago | 0.0 /100 | #298 | Tragic 15.8% |
| Hispanics or Latinos | 0.0 /100 | #299 | Tragic 15.8% |
| Immigrants | Bangladesh | 0.0 /100 | #300 | Tragic 15.9% |
| Trinidadians and Tobagonians | 0.0 /100 | #301 | Tragic 16.0% |
| Immigrants | West Indies | 0.0 /100 | #302 | Tragic 16.1% |
| Nicaraguans | 0.0 /100 | #303 | Tragic 16.1% |
| West Indians | 0.0 /100 | #304 | Tragic 16.3% |
| Immigrants | Azores | 0.0 /100 | #305 | Tragic 16.4% |
| Jamaicans | 0.0 /100 | #306 | Tragic 16.4% |
| Houma | 0.0 /100 | #307 | Tragic 16.5% |
| Barbadians | 0.0 /100 | #308 | Tragic 16.5% |