Immigrants from Oceania vs Trinidadian and Tobagonian Receiving Food Stamps
COMPARE
Immigrants from Oceania
Trinidadian and Tobagonian
Receiving Food Stamps
Receiving Food Stamps Comparison
Immigrants from Oceania
Trinidadians and Tobagonians
11.4%
RECEIVING FOOD STAMPS
70.4/ 100
METRIC RATING
159th/ 347
METRIC RANK
16.0%
RECEIVING FOOD STAMPS
0.0/ 100
METRIC RATING
301st/ 347
METRIC RANK
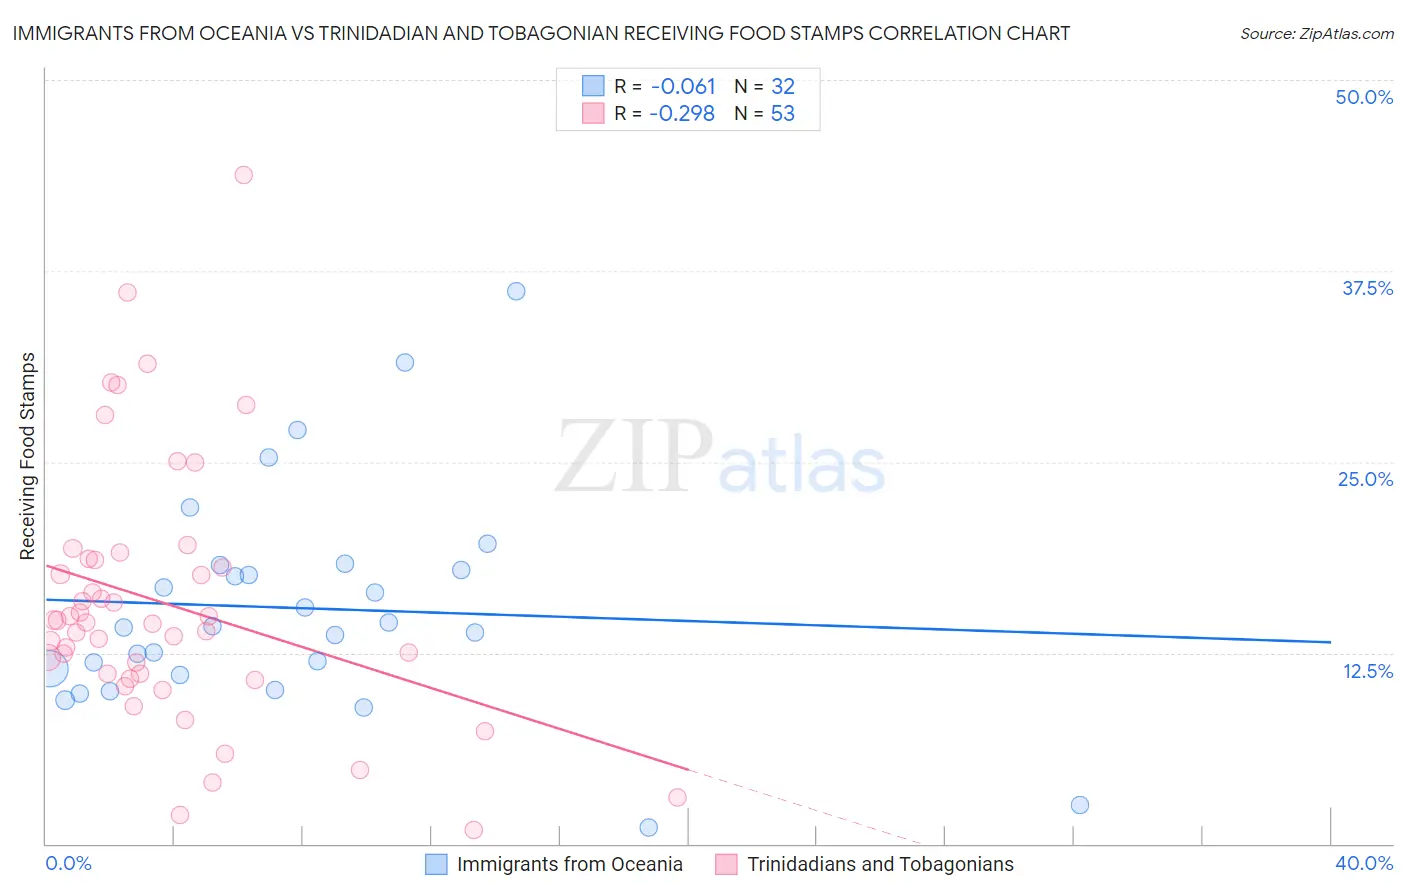
Immigrants from Oceania vs Trinidadian and Tobagonian Receiving Food Stamps Correlation Chart
The statistical analysis conducted on geographies consisting of 304,706,575 people shows a slight negative correlation between the proportion of Immigrants from Oceania and percentage of population receiving government assistance and/or food stamps in the United States with a correlation coefficient (R) of -0.061 and weighted average of 11.4%. Similarly, the statistical analysis conducted on geographies consisting of 219,495,740 people shows a weak negative correlation between the proportion of Trinidadians and Tobagonians and percentage of population receiving government assistance and/or food stamps in the United States with a correlation coefficient (R) of -0.298 and weighted average of 16.0%, a difference of 40.4%.
Receiving Food Stamps Correlation Summary
| Measurement | Immigrants from Oceania | Trinidadian and Tobagonian |
| Minimum | 1.1% | 0.90% |
| Maximum | 36.2% | 43.8% |
| Range | 35.1% | 42.9% |
| Mean | 15.4% | 15.7% |
| Median | 14.2% | 14.5% |
| Interquartile 25% (IQ1) | 11.2% | 10.9% |
| Interquartile 75% (IQ3) | 18.1% | 18.6% |
| Interquartile Range (IQR) | 6.9% | 7.7% |
| Standard Deviation (Sample) | 7.3% | 8.5% |
| Standard Deviation (Population) | 7.2% | 8.4% |
Similar Demographics by Receiving Food Stamps
Demographics Similar to Immigrants from Oceania by Receiving Food Stamps
In terms of receiving food stamps, the demographic groups most similar to Immigrants from Oceania are French Canadian (11.4%, a difference of 0.16%), Pennsylvania German (11.4%, a difference of 0.34%), Immigrants from Bosnia and Herzegovina (11.3%, a difference of 0.39%), Alsatian (11.4%, a difference of 0.41%), and Immigrants from Southern Europe (11.5%, a difference of 0.78%).
| Demographics | Rating | Rank | Receiving Food Stamps |
| Immigrants | Kazakhstan | 81.7 /100 | #152 | Excellent 11.1% |
| Lebanese | 81.6 /100 | #153 | Excellent 11.1% |
| Armenians | 81.4 /100 | #154 | Excellent 11.1% |
| Immigrants | Argentina | 80.4 /100 | #155 | Excellent 11.2% |
| Immigrants | Afghanistan | 75.6 /100 | #156 | Good 11.3% |
| Immigrants | Lebanon | 75.2 /100 | #157 | Good 11.3% |
| Immigrants | Bosnia and Herzegovina | 72.6 /100 | #158 | Good 11.3% |
| Immigrants | Oceania | 70.4 /100 | #159 | Good 11.4% |
| French Canadians | 69.5 /100 | #160 | Good 11.4% |
| Pennsylvania Germans | 68.4 /100 | #161 | Good 11.4% |
| Alsatians | 68.0 /100 | #162 | Good 11.4% |
| Immigrants | Southern Europe | 65.8 /100 | #163 | Good 11.5% |
| Immigrants | Chile | 65.0 /100 | #164 | Good 11.5% |
| Arabs | 64.7 /100 | #165 | Good 11.5% |
| Immigrants | Belarus | 62.8 /100 | #166 | Good 11.5% |
Demographics Similar to Trinidadians and Tobagonians by Receiving Food Stamps
In terms of receiving food stamps, the demographic groups most similar to Trinidadians and Tobagonians are Immigrants from Bangladesh (15.9%, a difference of 0.45%), Hispanic or Latino (15.8%, a difference of 0.89%), Immigrants from West Indies (16.1%, a difference of 0.94%), Nicaraguan (16.1%, a difference of 1.0%), and Immigrants from Trinidad and Tobago (15.8%, a difference of 1.2%).
| Demographics | Rating | Rank | Receiving Food Stamps |
| Immigrants | Latin America | 0.0 /100 | #294 | Tragic 15.7% |
| Immigrants | Honduras | 0.0 /100 | #295 | Tragic 15.7% |
| Tsimshian | 0.0 /100 | #296 | Tragic 15.7% |
| Immigrants | Bahamas | 0.0 /100 | #297 | Tragic 15.8% |
| Immigrants | Trinidad and Tobago | 0.0 /100 | #298 | Tragic 15.8% |
| Hispanics or Latinos | 0.0 /100 | #299 | Tragic 15.8% |
| Immigrants | Bangladesh | 0.0 /100 | #300 | Tragic 15.9% |
| Trinidadians and Tobagonians | 0.0 /100 | #301 | Tragic 16.0% |
| Immigrants | West Indies | 0.0 /100 | #302 | Tragic 16.1% |
| Nicaraguans | 0.0 /100 | #303 | Tragic 16.1% |
| West Indians | 0.0 /100 | #304 | Tragic 16.3% |
| Immigrants | Azores | 0.0 /100 | #305 | Tragic 16.4% |
| Jamaicans | 0.0 /100 | #306 | Tragic 16.4% |
| Houma | 0.0 /100 | #307 | Tragic 16.5% |
| Barbadians | 0.0 /100 | #308 | Tragic 16.5% |