Mexican vs Egyptian Male Poverty
COMPARE
Mexican
Egyptian
Male Poverty
Male Poverty Comparison
Mexicans
Egyptians
13.7%
MALE POVERTY
0.0/ 100
METRIC RATING
280th/ 347
METRIC RANK
10.3%
MALE POVERTY
95.9/ 100
METRIC RATING
82nd/ 347
METRIC RANK
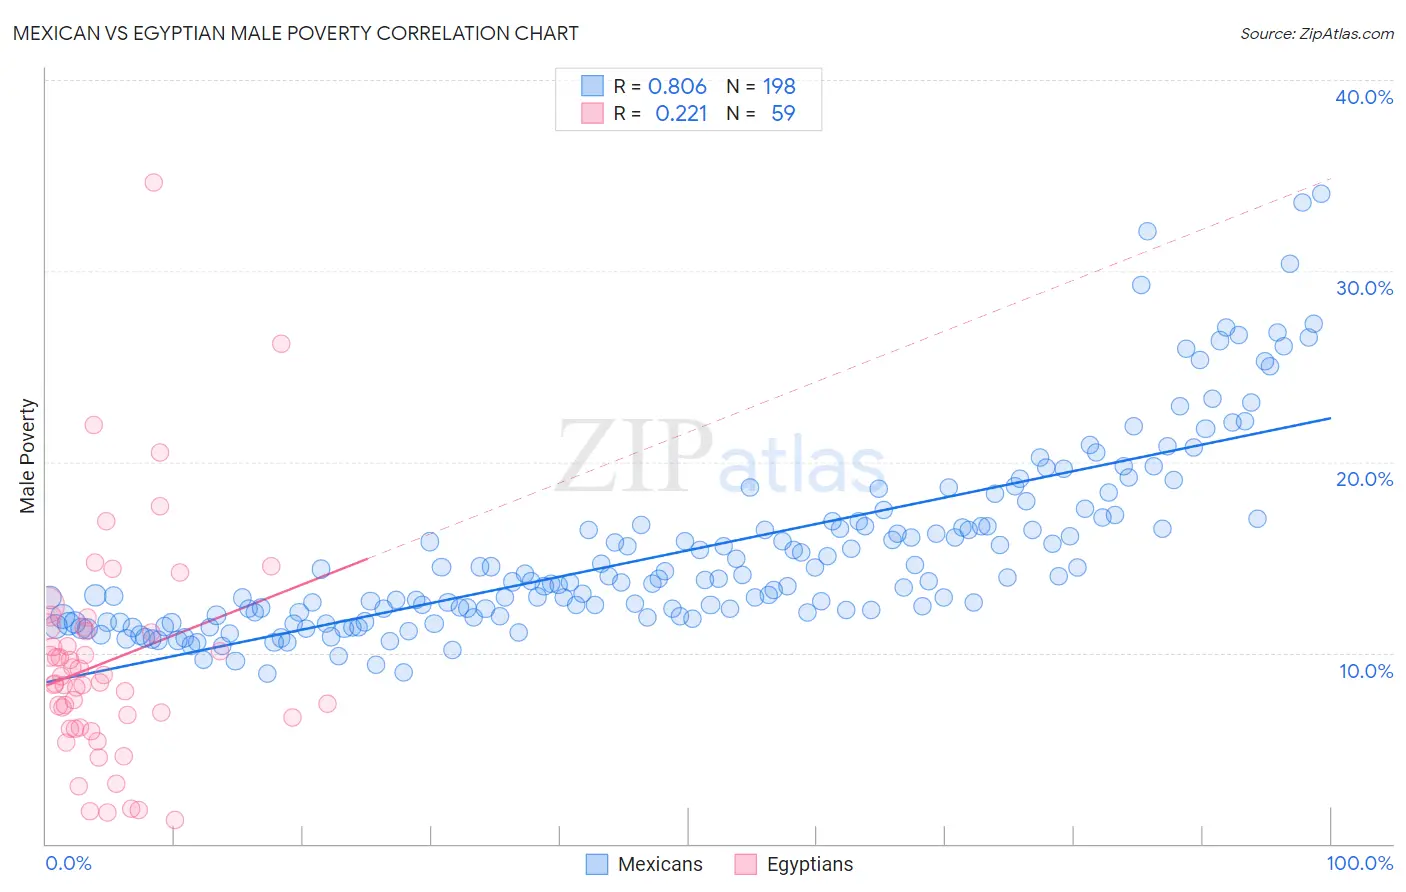
Mexican vs Egyptian Male Poverty Correlation Chart
The statistical analysis conducted on geographies consisting of 563,818,602 people shows a very strong positive correlation between the proportion of Mexicans and poverty level among males in the United States with a correlation coefficient (R) of 0.806 and weighted average of 13.7%. Similarly, the statistical analysis conducted on geographies consisting of 276,705,416 people shows a weak positive correlation between the proportion of Egyptians and poverty level among males in the United States with a correlation coefficient (R) of 0.221 and weighted average of 10.3%, a difference of 32.5%.
Male Poverty Correlation Summary
| Measurement | Mexican | Egyptian |
| Minimum | 8.9% | 1.2% |
| Maximum | 34.1% | 34.6% |
| Range | 25.2% | 33.4% |
| Mean | 15.3% | 9.6% |
| Median | 13.7% | 8.4% |
| Interquartile 25% (IQ1) | 11.9% | 6.1% |
| Interquartile 75% (IQ3) | 16.7% | 11.3% |
| Interquartile Range (IQR) | 4.8% | 5.2% |
| Standard Deviation (Sample) | 4.9% | 5.9% |
| Standard Deviation (Population) | 4.9% | 5.9% |
Similar Demographics by Male Poverty
Demographics Similar to Mexicans by Male Poverty
In terms of male poverty, the demographic groups most similar to Mexicans are Yaqui (13.7%, a difference of 0.050%), Haitian (13.7%, a difference of 0.090%), Belizean (13.6%, a difference of 0.27%), Immigrants from Cabo Verde (13.7%, a difference of 0.32%), and Bangladeshi (13.6%, a difference of 0.37%).
| Demographics | Rating | Rank | Male Poverty |
| Chickasaw | 0.0 /100 | #273 | Tragic 13.5% |
| Immigrants | West Indies | 0.0 /100 | #274 | Tragic 13.5% |
| Barbadians | 0.0 /100 | #275 | Tragic 13.6% |
| Immigrants | Latin America | 0.0 /100 | #276 | Tragic 13.6% |
| Bangladeshis | 0.0 /100 | #277 | Tragic 13.6% |
| Belizeans | 0.0 /100 | #278 | Tragic 13.6% |
| Haitians | 0.0 /100 | #279 | Tragic 13.7% |
| Mexicans | 0.0 /100 | #280 | Tragic 13.7% |
| Yaqui | 0.0 /100 | #281 | Tragic 13.7% |
| Immigrants | Cabo Verde | 0.0 /100 | #282 | Tragic 13.7% |
| Comanche | 0.0 /100 | #283 | Tragic 13.8% |
| Immigrants | Haiti | 0.0 /100 | #284 | Tragic 13.8% |
| West Indians | 0.0 /100 | #285 | Tragic 13.8% |
| Shoshone | 0.0 /100 | #286 | Tragic 13.8% |
| Immigrants | Barbados | 0.0 /100 | #287 | Tragic 13.8% |
Demographics Similar to Egyptians by Male Poverty
In terms of male poverty, the demographic groups most similar to Egyptians are Belgian (10.3%, a difference of 0.0%), Immigrants from Sweden (10.3%, a difference of 0.12%), Czechoslovakian (10.3%, a difference of 0.19%), Immigrants from England (10.4%, a difference of 0.23%), and Immigrants from Eastern Asia (10.4%, a difference of 0.37%).
| Demographics | Rating | Rank | Male Poverty |
| Carpatho Rusyns | 96.9 /100 | #75 | Exceptional 10.2% |
| Dutch | 96.9 /100 | #76 | Exceptional 10.2% |
| Immigrants | Belgium | 96.8 /100 | #77 | Exceptional 10.3% |
| Irish | 96.8 /100 | #78 | Exceptional 10.3% |
| Immigrants | North America | 96.5 /100 | #79 | Exceptional 10.3% |
| English | 96.4 /100 | #80 | Exceptional 10.3% |
| Belgians | 95.9 /100 | #81 | Exceptional 10.3% |
| Egyptians | 95.9 /100 | #82 | Exceptional 10.3% |
| Immigrants | Sweden | 95.7 /100 | #83 | Exceptional 10.3% |
| Czechoslovakians | 95.6 /100 | #84 | Exceptional 10.3% |
| Immigrants | England | 95.5 /100 | #85 | Exceptional 10.4% |
| Immigrants | Eastern Asia | 95.3 /100 | #86 | Exceptional 10.4% |
| Northern Europeans | 95.2 /100 | #87 | Exceptional 10.4% |
| Cambodians | 95.0 /100 | #88 | Exceptional 10.4% |
| Immigrants | Denmark | 95.0 /100 | #89 | Exceptional 10.4% |