Hungarian vs Immigrants from Somalia Median Female Earnings

COMPARE

Hungarian
Race
Ancestry
AfghanAfricanAlaska NativeAlaskan AthabascanAlbanianAleutAlsatianAmericanApacheArabArapahoArgentineanArmenianAssyrian/Chaldean/SyriacAustralianAustrianBahamianBangladeshiBarbadianBasqueBelgianBelizeanBermudanBhutaneseBlackfeetBolivianBrazilianBritishBritish West IndianBulgarianBurmeseCajunCambodianCanadianCape VerdeanCarpatho RusynCelticCentral AmericanCentral American IndianCherokeeCheyenneChickasawChileanChineseChippewaChoctawColombianColvilleComancheCosta RicanCreeCreekCroatianCrowCubanCypriotCzechCzechoslovakianDanishDelawareDominicanDutchDutch West IndianEastern EuropeanEcuadorianEgyptianEnglishEstonianEthiopianEuropeanFijianFilipinoFinnishFrenchFrench American IndianFrench CanadianGermanGerman RussianGhanaianGreekGuamanian/ChamorroGuatemalanGuyaneseHaitianHmongHonduranHopiHoumaHungarianIcelanderIndian (Asian)IndonesianInupiatIranianIraqiIrishIroquoisIsraeliItalianJamaicanJapaneseJordanianKenyanKiowaKoreanLaotianLatvianLebaneseLiberianLithuanianLumbeeLuxembourgerMacedonianMalaysianMalteseMarshalleseMenomineeMexicanMexican American IndianMongolianMoroccanNative HawaiianNavajoNepaleseNew ZealanderNicaraguanNigerianNorthern EuropeanNorwegianOkinawanOsageOttawaPaiutePakistaniPalestinianPanamanianParaguayanPennsylvania GermanPeruvianPimaPolishPortuguesePotawatomiPuebloPuerto RicanPuget Sound SalishRomanianRussianSalvadoranSamoanScandinavianScotch-IrishScottishSeminoleSenegaleseSerbianShoshoneSierra LeoneanSiouxSlavicSlovakSloveneSomaliSouth AfricanSouth AmericanSouth American IndianSoviet UnionSpaniardSpanishSpanish AmericanSpanish American IndianSri LankanSubsaharan AfricanSudaneseSwedishSwissSyrianTaiwaneseThaiTlingit-HaidaTohono O'OdhamTonganTrinidadian and TobagonianTsimshianTurkishU.S. Virgin IslanderUgandanUkrainianUruguayanUteVenezuelanVietnameseWelshWest IndianYakamaYaquiYugoslavianYumanYup'ikZimbabwean
Immigration
NonimmigrantsImmigrantsAfghanistanAfricaAlbaniaArgentinaArmeniaAsiaAustraliaAustriaBahamasBangladeshBarbadosBelarusBelgiumBelizeBoliviaBosnia and HerzegovinaBrazilBulgariaBurma/MyanmarCabo VerdeCambodiaCameroonCanadaCaribbeanCentral AmericaChileChinaColombiaCongoCosta RicaCroatiaCubaCzechoslovakiaDenmarkDominicaDominican RepublicEastern AfricaEastern AsiaEastern EuropeEcuadorEgyptEl SalvadorEnglandEritreaEthiopiaEuropeFijiFranceGermanyGhanaGreeceGrenadaGuatemalaGuyanaHaitiHondurasHong KongHungaryIndiaIndonesiaIranIraqIrelandIsraelItalyJamaicaJapanJordanKazakhstanKenyaKoreaKuwaitLaosLatin AmericaLatviaLebanonLiberiaLithuaniaMalaysiaMexicoMicronesiaMiddle AfricaMoldovaMoroccoNepalNetherlandsNicaraguaNigeriaNorth AmericaNorth MacedoniaNorthern AfricaNorthern EuropeNorwayOceaniaPakistanPanamaPeruPhilippinesPolandPortugalRomaniaRussiaSaudi ArabiaScotlandSenegalSerbiaSierra LeoneSingaporeSouth AfricaSouth AmericaSouth Central AsiaSouth Eastern AsiaSouthern EuropeSpainSri LankaSt. Vincent and the GrenadinesSudanSwedenSwitzerlandSyriaTaiwanThailandTrinidad and TobagoTurkeyUgandaUkraineUruguayUzbekistanVenezuelaVietnamWest IndiesWestern AfricaWestern AsiaWestern EuropeYemenZaireZimbabweAzores
Immigrants from Somalia
Race
Ancestry
AfghanAfricanAlaska NativeAlaskan AthabascanAlbanianAleutAlsatianAmericanApacheArabArapahoArgentineanArmenianAssyrian/Chaldean/SyriacAustralianAustrianBahamianBangladeshiBarbadianBasqueBelgianBelizeanBermudanBhutaneseBlackfeetBolivianBrazilianBritishBritish West IndianBulgarianBurmeseCajunCambodianCanadianCape VerdeanCarpatho RusynCelticCentral AmericanCentral American IndianCherokeeCheyenneChickasawChileanChineseChippewaChoctawColombianColvilleComancheCosta RicanCreeCreekCroatianCrowCubanCypriotCzechCzechoslovakianDanishDelawareDominicanDutchDutch West IndianEastern EuropeanEcuadorianEgyptianEnglishEstonianEthiopianEuropeanFijianFilipinoFinnishFrenchFrench American IndianFrench CanadianGermanGerman RussianGhanaianGreekGuamanian/ChamorroGuatemalanGuyaneseHaitianHmongHonduranHopiHoumaIcelanderIndian (Asian)IndonesianInupiatIranianIraqiIrishIroquoisIsraeliItalianJamaicanJapaneseJordanianKenyanKiowaKoreanLaotianLatvianLebaneseLiberianLithuanianLumbeeLuxembourgerMacedonianMalaysianMalteseMarshalleseMenomineeMexicanMexican American IndianMongolianMoroccanNative HawaiianNavajoNepaleseNew ZealanderNicaraguanNigerianNorthern EuropeanNorwegianOkinawanOsageOttawaPaiutePakistaniPalestinianPanamanianParaguayanPennsylvania GermanPeruvianPimaPolishPortuguesePotawatomiPuebloPuerto RicanPuget Sound SalishRomanianRussianSalvadoranSamoanScandinavianScotch-IrishScottishSeminoleSenegaleseSerbianShoshoneSierra LeoneanSiouxSlavicSlovakSloveneSomaliSouth AfricanSouth AmericanSouth American IndianSoviet UnionSpaniardSpanishSpanish AmericanSpanish American IndianSri LankanSubsaharan AfricanSudaneseSwedishSwissSyrianTaiwaneseThaiTlingit-HaidaTohono O'OdhamTonganTrinidadian and TobagonianTsimshianTurkishU.S. Virgin IslanderUgandanUkrainianUruguayanUteVenezuelanVietnameseWelshWest IndianYakamaYaquiYugoslavianYumanYup'ikZimbabwean
Immigration
NonimmigrantsImmigrantsAfghanistanAfricaAlbaniaArgentinaArmeniaAsiaAustraliaAustriaBahamasBangladeshBarbadosBelarusBelgiumBelizeBoliviaBosnia and HerzegovinaBrazilBulgariaBurma/MyanmarCabo VerdeCambodiaCameroonCanadaCaribbeanCentral AmericaChileChinaColombiaCongoCosta RicaCroatiaCubaCzechoslovakiaDenmarkDominicaDominican RepublicEastern AfricaEastern AsiaEastern EuropeEcuadorEgyptEl SalvadorEnglandEritreaEthiopiaEuropeFijiFranceGermanyGhanaGreeceGrenadaGuatemalaGuyanaHaitiHondurasHong KongHungaryIndiaIndonesiaIranIraqIrelandIsraelItalyJamaicaJapanJordanKazakhstanKenyaKoreaKuwaitLaosLatin AmericaLatviaLebanonLiberiaLithuaniaMalaysiaMexicoMicronesiaMiddle AfricaMoldovaMoroccoNepalNetherlandsNicaraguaNigeriaNorth AmericaNorth MacedoniaNorthern AfricaNorthern EuropeNorwayOceaniaPakistanPanamaPeruPhilippinesPolandPortugalRomaniaRussiaSaudi ArabiaScotlandSenegalSerbiaSierra LeoneSingaporeSomaliaSouth AfricaSouth AmericaSouth Central AsiaSouth Eastern AsiaSouthern EuropeSpainSri LankaSt. Vincent and the GrenadinesSudanSwedenSwitzerlandSyriaTaiwanThailandTrinidad and TobagoTurkeyUgandaUkraineUruguayUzbekistanVenezuelaVietnamWest IndiesWestern AfricaWestern AsiaWestern EuropeYemenZaireZimbabweAzores
Median Female Earnings
Income
Poverty
Unemployment
Labor Participation
Family Structure
Vehicle Availability
Education Level
Disability

Median Female Earnings Comparison

Hungarians

Immigrants from Somalia

Average
Tragic
$39,510
MEDIAN FEMALE EARNINGS
40.3/ 100
METRIC RATING
183rd/ 347
METRIC RANK
$37,914
MEDIAN FEMALE EARNINGS
2.4/ 100
METRIC RATING
247th/ 347
METRIC RANK

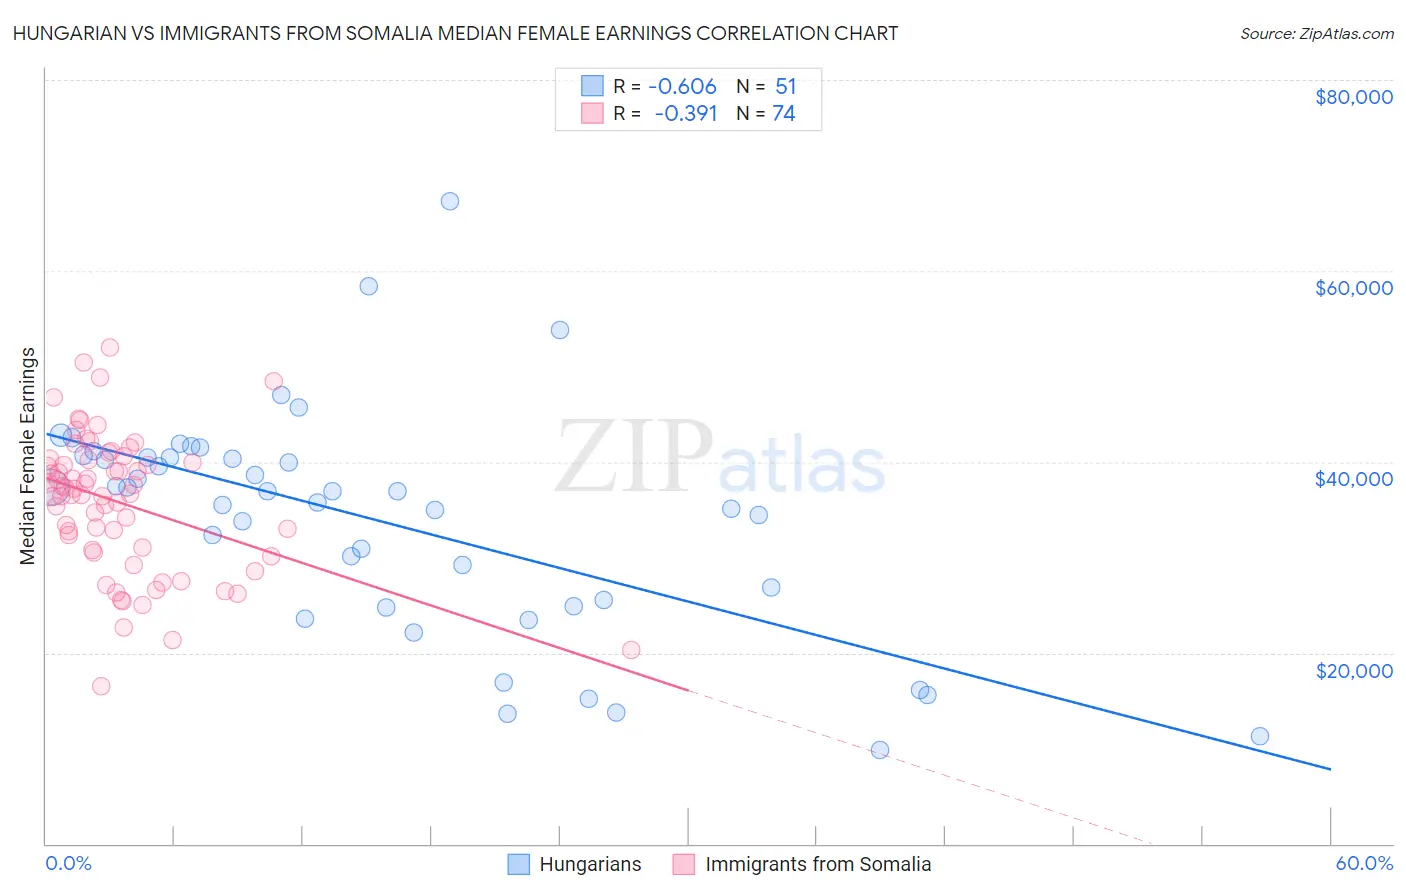
Hungarian vs Immigrants from Somalia Median Female Earnings Correlation Chart

The statistical analysis conducted on geographies consisting of 485,733,652 people shows a significant negative correlation between the proportion of Hungarians and median female earnings in the United States with a correlation coefficient (R) of -0.606 and weighted average of $39,510. Similarly, the statistical analysis conducted on geographies consisting of 92,105,737 people shows a mild negative correlation between the proportion of Immigrants from Somalia and median female earnings in the United States with a correlation coefficient (R) of -0.391 and weighted average of $37,914, a difference of 4.2%.
Hungarian vs Immigrants from Somalia Median Female Earnings

Median Female Earnings Correlation Summary

MeasurementHungarianImmigrants from Somalia
Minimum$9,845$16,542
Maximum$67,329$51,945
Range$57,484$35,403
Mean$33,736$35,740
Median$36,875$36,925
Interquartile 25% (IQ1)$24,845$30,785
Interquartile 75% (IQ3)$40,519$40,139
Interquartile Range (IQR)$15,674$9,354
Standard Deviation (Sample)$11,915$7,218
Standard Deviation (Population)$11,798$7,169

Similar Demographics by Median Female Earnings

Demographics Similar to Hungarians by Median Female Earnings

In terms of median female earnings, the demographic groups most similar to Hungarians are Tlingit-Haida ($39,513, a difference of 0.010%), Tsimshian ($39,530, a difference of 0.050%), Immigrants from Kenya ($39,535, a difference of 0.060%), European ($39,457, a difference of 0.13%), and Immigrants from West Indies ($39,441, a difference of 0.18%).
DemographicsRating | RankMedian Female Earnings
Nigerians
47.0
/100
|
#176
Average
$39,641
Costa Ricans
46.1
/100
|
#177
Average
$39,622
Slavs
45.6
/100
|
#178
Average
$39,613
Immigrants | Germany
45.1
/100
|
#179
Average
$39,603
Immigrants | Kenya
41.6
/100
|
#180
Average
$39,535
Tsimshian
41.4
/100
|
#181
Average
$39,530
Tlingit-Haida
40.5
/100
|
#182
Average
$39,513
Hungarians
40.3
/100
|
#183
Average
$39,510
Europeans
37.7
/100
|
#184
Fair
$39,457
Immigrants | West Indies
36.9
/100
|
#185
Fair
$39,441
Colombians
36.9
/100
|
#186
Fair
$39,439
Swedes
36.0
/100
|
#187
Fair
$39,421
Bermudans
35.9
/100
|
#188
Fair
$39,418
Senegalese
34.2
/100
|
#189
Fair
$39,384
Puget Sound Salish
33.9
/100
|
#190
Fair
$39,376

Demographics Similar to Immigrants from Somalia by Median Female Earnings

In terms of median female earnings, the demographic groups most similar to Immigrants from Somalia are Alaskan Athabascan ($37,905, a difference of 0.020%), Swiss ($37,904, a difference of 0.030%), Delaware ($37,964, a difference of 0.13%), Immigrants from Iraq ($37,864, a difference of 0.13%), and Immigrants from Middle Africa ($37,965, a difference of 0.14%).
DemographicsRating | RankMedian Female Earnings
Finns
4.0
/100
|
#240
Tragic
$38,173
Spanish
3.5
/100
|
#241
Tragic
$38,098
Immigrants | Burma/Myanmar
3.0
/100
|
#242
Tragic
$38,028
Germans
2.8
/100
|
#243
Tragic
$37,986
Immigrants | Liberia
2.7
/100
|
#244
Tragic
$37,970
Immigrants | Middle Africa
2.7
/100
|
#245
Tragic
$37,965
Delaware
2.6
/100
|
#246
Tragic
$37,964
Immigrants | Somalia
2.4
/100
|
#247
Tragic
$37,914
Alaskan Athabascans
2.3
/100
|
#248
Tragic
$37,905
Swiss
2.3
/100
|
#249
Tragic
$37,904
Immigrants | Iraq
2.2
/100
|
#250
Tragic
$37,864
Welsh
2.1
/100
|
#251
Tragic
$37,856
Immigrants | Dominica
2.0
/100
|
#252
Tragic
$37,825
Danes
1.6
/100
|
#253
Tragic
$37,730
Whites/Caucasians
1.1
/100
|
#254
Tragic
$37,531