Paraguayan vs Immigrants from Somalia Female Poverty
COMPARE
Paraguayan
Immigrants from Somalia
Female Poverty
Female Poverty Comparison
Paraguayans
Immigrants from Somalia
12.6%
FEMALE POVERTY
93.0/ 100
METRIC RATING
110th/ 347
METRIC RANK
17.0%
FEMALE POVERTY
0.0/ 100
METRIC RATING
312th/ 347
METRIC RANK
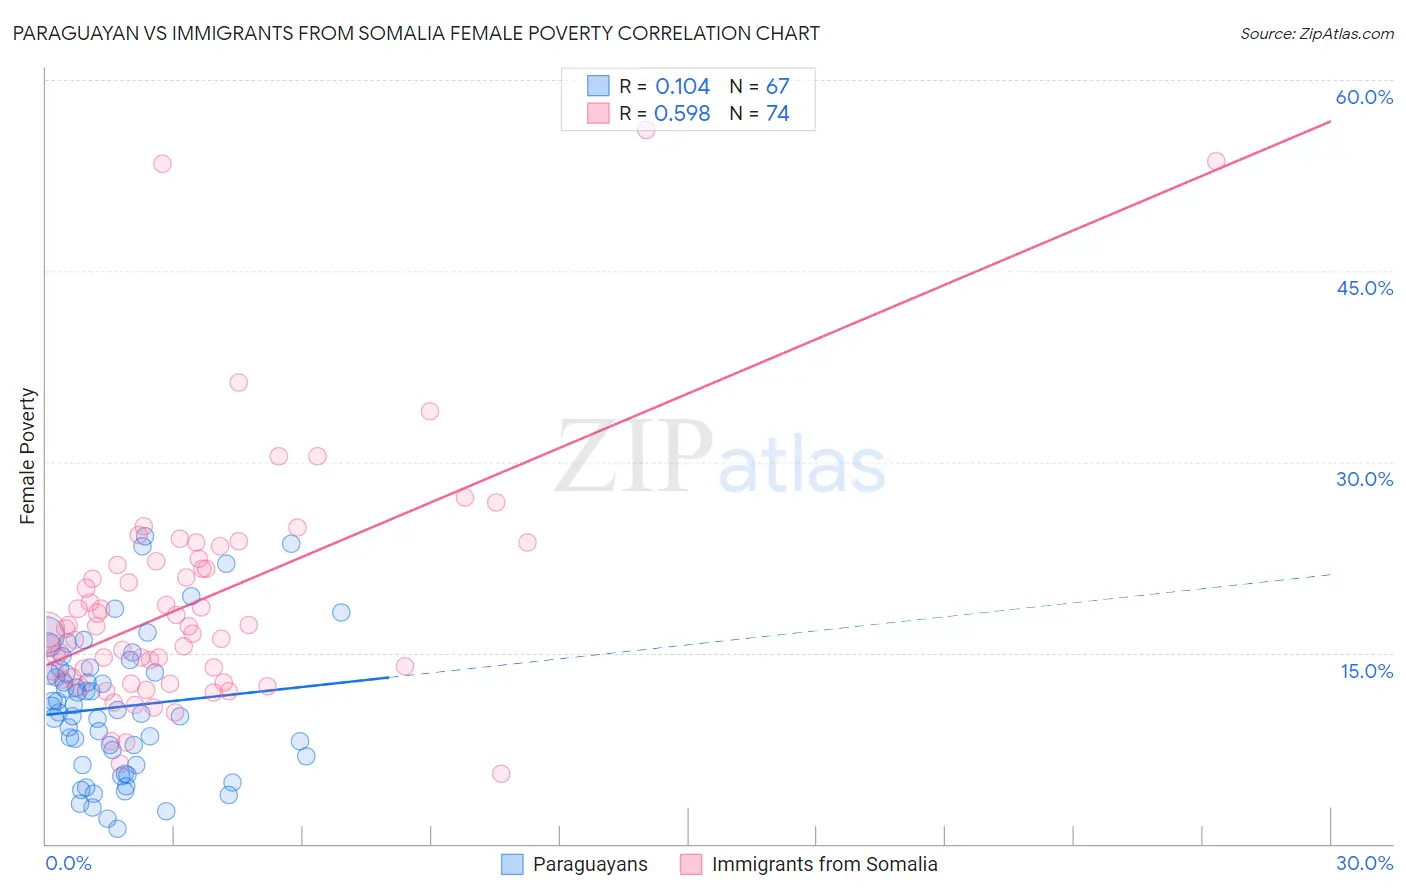
Paraguayan vs Immigrants from Somalia Female Poverty Correlation Chart
The statistical analysis conducted on geographies consisting of 95,097,647 people shows a poor positive correlation between the proportion of Paraguayans and poverty level among females in the United States with a correlation coefficient (R) of 0.104 and weighted average of 12.6%. Similarly, the statistical analysis conducted on geographies consisting of 92,101,870 people shows a substantial positive correlation between the proportion of Immigrants from Somalia and poverty level among females in the United States with a correlation coefficient (R) of 0.598 and weighted average of 17.0%, a difference of 35.0%.
Female Poverty Correlation Summary
| Measurement | Paraguayan | Immigrants from Somalia |
| Minimum | 1.2% | 5.5% |
| Maximum | 24.2% | 56.1% |
| Range | 23.0% | 50.6% |
| Mean | 10.7% | 19.1% |
| Median | 10.5% | 17.0% |
| Interquartile 25% (IQ1) | 6.2% | 13.1% |
| Interquartile 75% (IQ3) | 13.8% | 22.1% |
| Interquartile Range (IQR) | 7.6% | 9.1% |
| Standard Deviation (Sample) | 5.4% | 9.5% |
| Standard Deviation (Population) | 5.4% | 9.4% |
Similar Demographics by Female Poverty
Demographics Similar to Paraguayans by Female Poverty
In terms of female poverty, the demographic groups most similar to Paraguayans are Immigrants from Zimbabwe (12.6%, a difference of 0.030%), Portuguese (12.6%, a difference of 0.040%), Laotian (12.6%, a difference of 0.15%), Soviet Union (12.6%, a difference of 0.22%), and Immigrants from Turkey (12.6%, a difference of 0.33%).
| Demographics | Rating | Rank | Female Poverty |
| Slavs | 94.5 /100 | #103 | Exceptional 12.5% |
| Palestinians | 94.3 /100 | #104 | Exceptional 12.5% |
| Scottish | 94.1 /100 | #105 | Exceptional 12.5% |
| Immigrants | Turkey | 93.8 /100 | #106 | Exceptional 12.6% |
| Laotians | 93.4 /100 | #107 | Exceptional 12.6% |
| Portuguese | 93.1 /100 | #108 | Exceptional 12.6% |
| Immigrants | Zimbabwe | 93.1 /100 | #109 | Exceptional 12.6% |
| Paraguayans | 93.0 /100 | #110 | Exceptional 12.6% |
| Soviet Union | 92.4 /100 | #111 | Exceptional 12.6% |
| Immigrants | Israel | 92.0 /100 | #112 | Exceptional 12.6% |
| Canadians | 92.0 /100 | #113 | Exceptional 12.7% |
| Welsh | 91.6 /100 | #114 | Exceptional 12.7% |
| Puget Sound Salish | 91.5 /100 | #115 | Exceptional 12.7% |
| Immigrants | Russia | 91.2 /100 | #116 | Exceptional 12.7% |
| Immigrants | Southern Europe | 90.9 /100 | #117 | Exceptional 12.7% |
Demographics Similar to Immigrants from Somalia by Female Poverty
In terms of female poverty, the demographic groups most similar to Immigrants from Somalia are British West Indian (17.0%, a difference of 0.080%), Immigrants from Guatemala (17.0%, a difference of 0.090%), Creek (17.0%, a difference of 0.10%), Dutch West Indian (17.1%, a difference of 0.33%), and Immigrants from Mexico (17.0%, a difference of 0.34%).
| Demographics | Rating | Rank | Female Poverty |
| Immigrants | Grenada | 0.0 /100 | #305 | Tragic 16.8% |
| Immigrants | Caribbean | 0.0 /100 | #306 | Tragic 16.9% |
| Seminole | 0.0 /100 | #307 | Tragic 16.9% |
| Africans | 0.0 /100 | #308 | Tragic 16.9% |
| Immigrants | Mexico | 0.0 /100 | #309 | Tragic 17.0% |
| Creek | 0.0 /100 | #310 | Tragic 17.0% |
| Immigrants | Guatemala | 0.0 /100 | #311 | Tragic 17.0% |
| Immigrants | Somalia | 0.0 /100 | #312 | Tragic 17.0% |
| British West Indians | 0.0 /100 | #313 | Tragic 17.0% |
| Dutch West Indians | 0.0 /100 | #314 | Tragic 17.1% |
| U.S. Virgin Islanders | 0.0 /100 | #315 | Tragic 17.3% |
| Hondurans | 0.0 /100 | #316 | Tragic 17.4% |
| Immigrants | Congo | 0.0 /100 | #317 | Tragic 17.4% |
| Ute | 0.0 /100 | #318 | Tragic 17.5% |
| Cajuns | 0.0 /100 | #319 | Tragic 17.5% |