Central American Indian vs Immigrants from Somalia Female Poverty
COMPARE
Central American Indian
Immigrants from Somalia
Female Poverty
Female Poverty Comparison
Central American Indians
Immigrants from Somalia
18.0%
FEMALE POVERTY
0.0/ 100
METRIC RATING
326th/ 347
METRIC RANK
17.0%
FEMALE POVERTY
0.0/ 100
METRIC RATING
312th/ 347
METRIC RANK
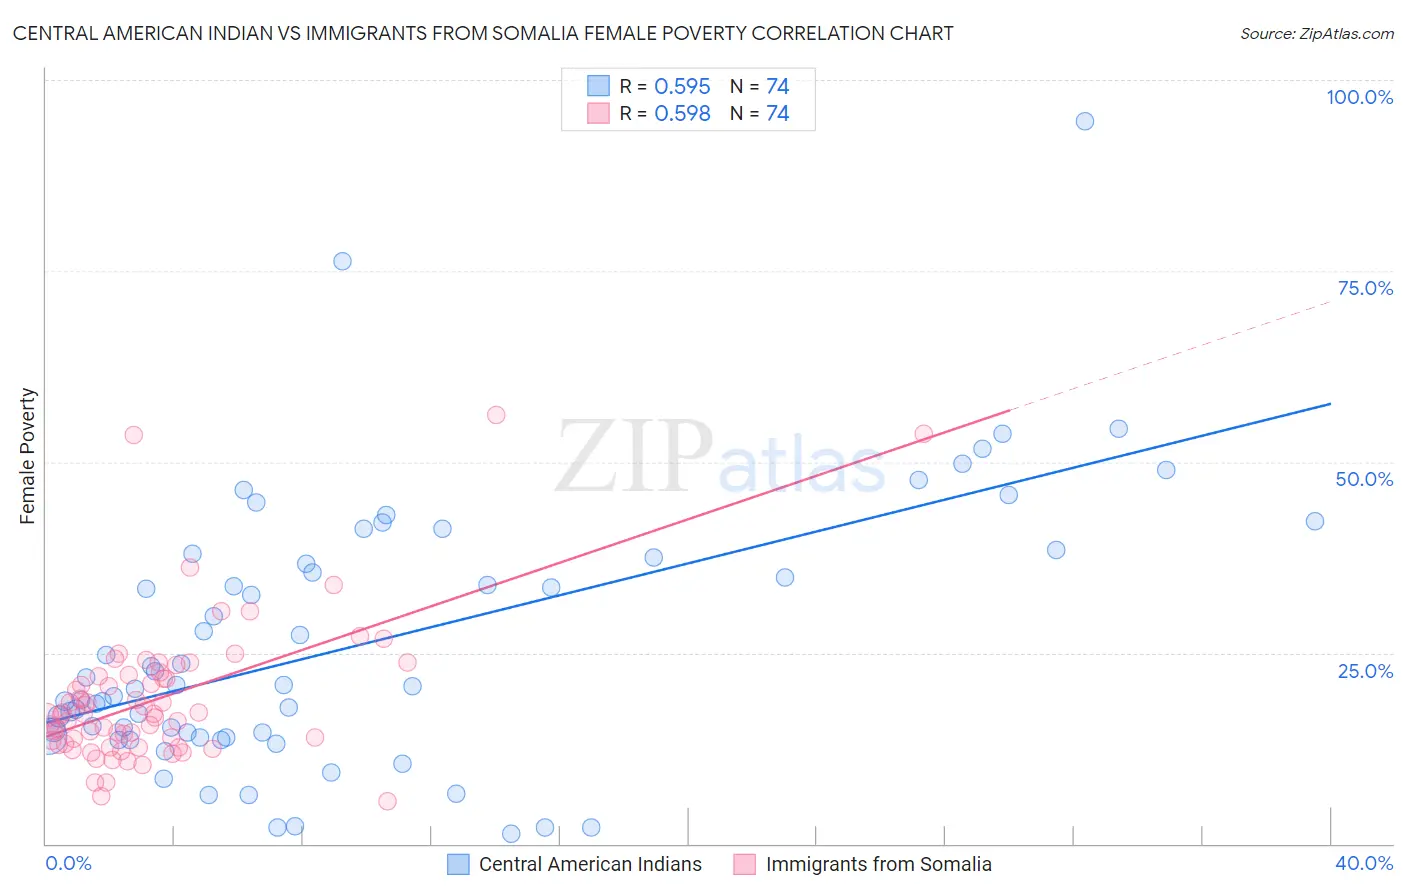
Central American Indian vs Immigrants from Somalia Female Poverty Correlation Chart
The statistical analysis conducted on geographies consisting of 326,040,737 people shows a substantial positive correlation between the proportion of Central American Indians and poverty level among females in the United States with a correlation coefficient (R) of 0.595 and weighted average of 18.0%. Similarly, the statistical analysis conducted on geographies consisting of 92,101,870 people shows a substantial positive correlation between the proportion of Immigrants from Somalia and poverty level among females in the United States with a correlation coefficient (R) of 0.598 and weighted average of 17.0%, a difference of 5.9%.
Female Poverty Correlation Summary
| Measurement | Central American Indian | Immigrants from Somalia |
| Minimum | 1.4% | 5.5% |
| Maximum | 94.5% | 56.1% |
| Range | 93.2% | 50.6% |
| Mean | 26.1% | 19.1% |
| Median | 20.8% | 17.0% |
| Interquartile 25% (IQ1) | 14.1% | 13.1% |
| Interquartile 75% (IQ3) | 37.5% | 22.1% |
| Interquartile Range (IQR) | 23.4% | 9.1% |
| Standard Deviation (Sample) | 17.4% | 9.5% |
| Standard Deviation (Population) | 17.3% | 9.4% |
Demographics Similar to Central American Indians and Immigrants from Somalia by Female Poverty
In terms of female poverty, the demographic groups most similar to Central American Indians are Yakama (18.0%, a difference of 0.10%), Colville (17.8%, a difference of 1.5%), Immigrants from Honduras (17.7%, a difference of 1.7%), Paiute (17.7%, a difference of 1.9%), and Menominee (17.6%, a difference of 2.5%). Similarly, the demographic groups most similar to Immigrants from Somalia are British West Indian (17.0%, a difference of 0.080%), Immigrants from Guatemala (17.0%, a difference of 0.090%), Creek (17.0%, a difference of 0.10%), Dutch West Indian (17.1%, a difference of 0.33%), and Immigrants from Mexico (17.0%, a difference of 0.34%).
| Demographics | Rating | Rank | Female Poverty |
| Immigrants | Mexico | 0.0 /100 | #309 | Tragic 17.0% |
| Creek | 0.0 /100 | #310 | Tragic 17.0% |
| Immigrants | Guatemala | 0.0 /100 | #311 | Tragic 17.0% |
| Immigrants | Somalia | 0.0 /100 | #312 | Tragic 17.0% |
| British West Indians | 0.0 /100 | #313 | Tragic 17.0% |
| Dutch West Indians | 0.0 /100 | #314 | Tragic 17.1% |
| U.S. Virgin Islanders | 0.0 /100 | #315 | Tragic 17.3% |
| Hondurans | 0.0 /100 | #316 | Tragic 17.4% |
| Immigrants | Congo | 0.0 /100 | #317 | Tragic 17.4% |
| Ute | 0.0 /100 | #318 | Tragic 17.5% |
| Cajuns | 0.0 /100 | #319 | Tragic 17.5% |
| Immigrants | Dominica | 0.0 /100 | #320 | Tragic 17.5% |
| Arapaho | 0.0 /100 | #321 | Tragic 17.5% |
| Menominee | 0.0 /100 | #322 | Tragic 17.6% |
| Paiute | 0.0 /100 | #323 | Tragic 17.7% |
| Immigrants | Honduras | 0.0 /100 | #324 | Tragic 17.7% |
| Colville | 0.0 /100 | #325 | Tragic 17.8% |
| Central American Indians | 0.0 /100 | #326 | Tragic 18.0% |
| Yakama | 0.0 /100 | #327 | Tragic 18.0% |
| Blacks/African Americans | 0.0 /100 | #328 | Tragic 18.6% |
| Kiowa | 0.0 /100 | #329 | Tragic 18.6% |