Immigrants from Latin America vs Immigrants from Ghana Poverty
COMPARE
Immigrants from Latin America
Immigrants from Ghana
Poverty
Poverty Comparison
Immigrants from Latin America
Immigrants from Ghana
15.0%
POVERTY
0.0/ 100
METRIC RATING
286th/ 347
METRIC RANK
14.2%
POVERTY
0.2/ 100
METRIC RATING
249th/ 347
METRIC RANK
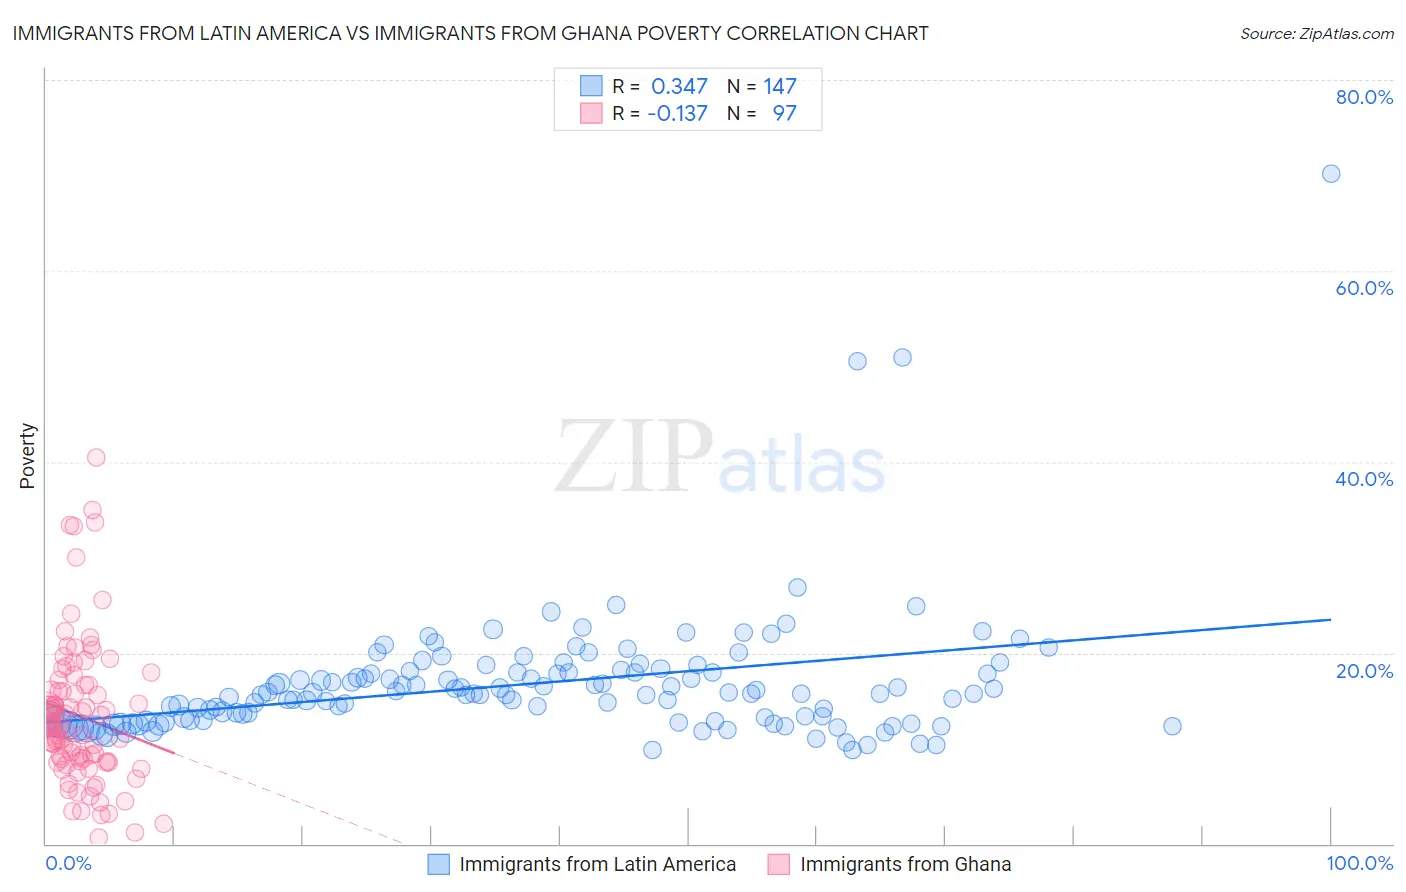
Immigrants from Latin America vs Immigrants from Ghana Poverty Correlation Chart
The statistical analysis conducted on geographies consisting of 557,920,338 people shows a mild positive correlation between the proportion of Immigrants from Latin America and poverty level in the United States with a correlation coefficient (R) of 0.347 and weighted average of 15.0%. Similarly, the statistical analysis conducted on geographies consisting of 199,808,032 people shows a poor negative correlation between the proportion of Immigrants from Ghana and poverty level in the United States with a correlation coefficient (R) of -0.137 and weighted average of 14.2%, a difference of 6.2%.
Poverty Correlation Summary
| Measurement | Immigrants from Latin America | Immigrants from Ghana |
| Minimum | 9.8% | 0.71% |
| Maximum | 70.2% | 40.5% |
| Range | 60.4% | 39.8% |
| Mean | 16.7% | 13.4% |
| Median | 15.7% | 12.2% |
| Interquartile 25% (IQ1) | 12.9% | 8.5% |
| Interquartile 75% (IQ3) | 17.9% | 16.6% |
| Interquartile Range (IQR) | 5.0% | 8.1% |
| Standard Deviation (Sample) | 6.9% | 7.6% |
| Standard Deviation (Population) | 6.9% | 7.5% |
Similar Demographics by Poverty
Demographics Similar to Immigrants from Latin America by Poverty
In terms of poverty, the demographic groups most similar to Immigrants from Latin America are Inupiat (15.1%, a difference of 0.21%), Yaqui (15.1%, a difference of 0.22%), Vietnamese (15.0%, a difference of 0.26%), West Indian (15.0%, a difference of 0.32%), and Immigrants from Belize (15.1%, a difference of 0.34%).
| Demographics | Rating | Rank | Poverty |
| Immigrants | St. Vincent and the Grenadines | 0.0 /100 | #279 | Tragic 14.9% |
| Haitians | 0.0 /100 | #280 | Tragic 14.9% |
| Immigrants | Barbados | 0.0 /100 | #281 | Tragic 14.9% |
| Comanche | 0.0 /100 | #282 | Tragic 15.0% |
| Immigrants | Haiti | 0.0 /100 | #283 | Tragic 15.0% |
| West Indians | 0.0 /100 | #284 | Tragic 15.0% |
| Vietnamese | 0.0 /100 | #285 | Tragic 15.0% |
| Immigrants | Latin America | 0.0 /100 | #286 | Tragic 15.0% |
| Inupiat | 0.0 /100 | #287 | Tragic 15.1% |
| Yaqui | 0.0 /100 | #288 | Tragic 15.1% |
| Immigrants | Belize | 0.0 /100 | #289 | Tragic 15.1% |
| Mexicans | 0.0 /100 | #290 | Tragic 15.1% |
| Immigrants | Cabo Verde | 0.0 /100 | #291 | Tragic 15.1% |
| Indonesians | 0.0 /100 | #292 | Tragic 15.1% |
| Immigrants | Zaire | 0.0 /100 | #293 | Tragic 15.1% |
Demographics Similar to Immigrants from Ghana by Poverty
In terms of poverty, the demographic groups most similar to Immigrants from Ghana are Immigrants from Western Africa (14.1%, a difference of 0.090%), Liberian (14.1%, a difference of 0.11%), Cree (14.2%, a difference of 0.30%), Immigrants from Burma/Myanmar (14.2%, a difference of 0.39%), and Potawatomi (14.1%, a difference of 0.40%).
| Demographics | Rating | Rank | Poverty |
| Ecuadorians | 0.4 /100 | #242 | Tragic 14.0% |
| Sudanese | 0.3 /100 | #243 | Tragic 14.0% |
| Nepalese | 0.3 /100 | #244 | Tragic 14.0% |
| Immigrants | Sudan | 0.3 /100 | #245 | Tragic 14.1% |
| Potawatomi | 0.3 /100 | #246 | Tragic 14.1% |
| Liberians | 0.2 /100 | #247 | Tragic 14.1% |
| Immigrants | Western Africa | 0.2 /100 | #248 | Tragic 14.1% |
| Immigrants | Ghana | 0.2 /100 | #249 | Tragic 14.2% |
| Cree | 0.2 /100 | #250 | Tragic 14.2% |
| Immigrants | Burma/Myanmar | 0.2 /100 | #251 | Tragic 14.2% |
| Spanish American Indians | 0.2 /100 | #252 | Tragic 14.2% |
| Immigrants | Trinidad and Tobago | 0.2 /100 | #253 | Tragic 14.2% |
| Immigrants | El Salvador | 0.1 /100 | #254 | Tragic 14.3% |
| Immigrants | Ecuador | 0.1 /100 | #255 | Tragic 14.3% |
| Mexican American Indians | 0.1 /100 | #256 | Tragic 14.3% |