Cypriot vs Immigrants from Ghana Poverty
COMPARE
Cypriot
Immigrants from Ghana
Poverty
Poverty Comparison
Cypriots
Immigrants from Ghana
10.8%
POVERTY
99.3/ 100
METRIC RATING
36th/ 347
METRIC RANK
14.2%
POVERTY
0.2/ 100
METRIC RATING
249th/ 347
METRIC RANK
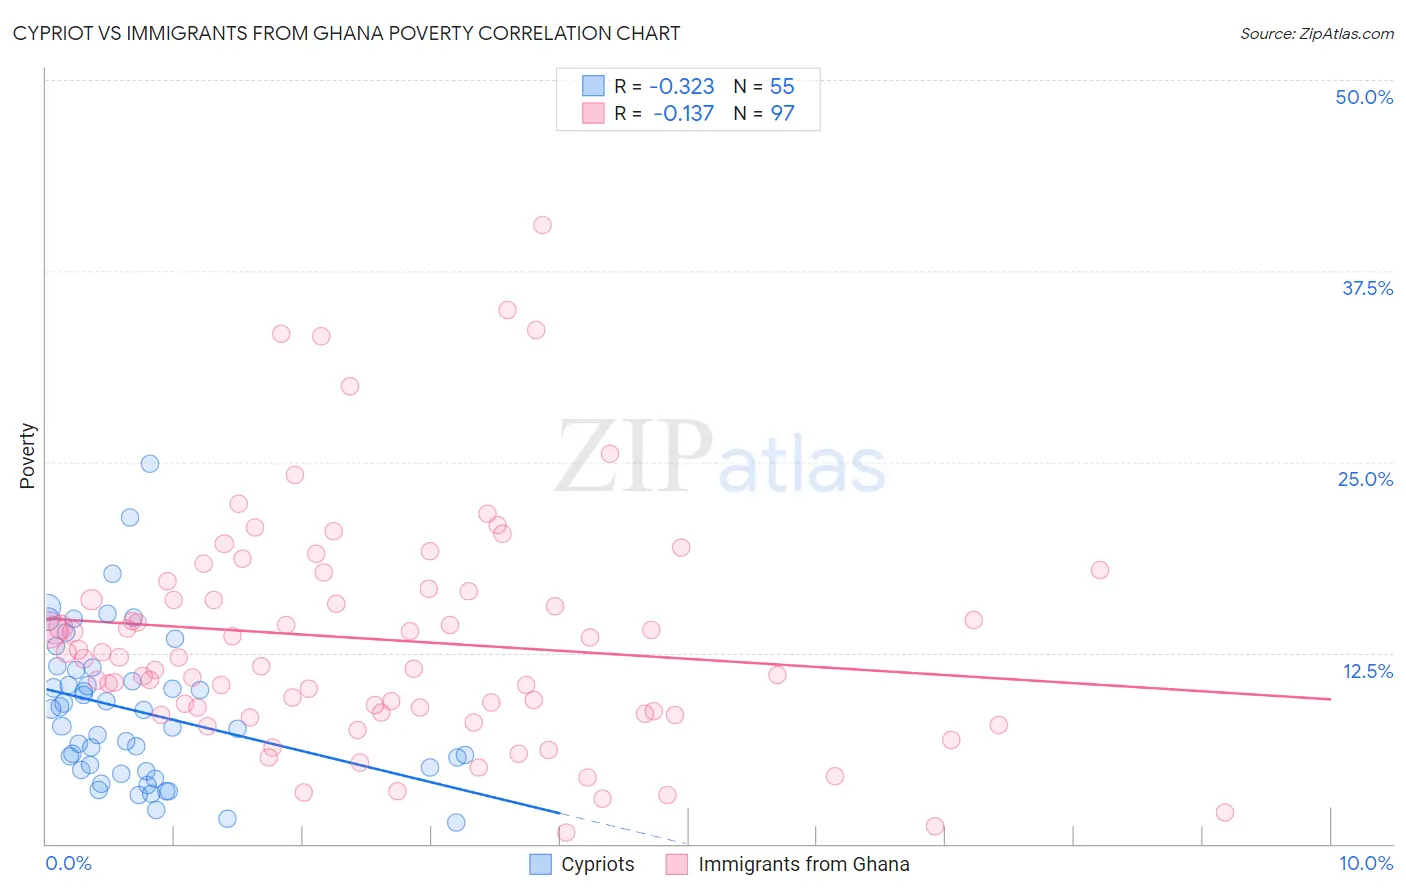
Cypriot vs Immigrants from Ghana Poverty Correlation Chart
The statistical analysis conducted on geographies consisting of 61,850,194 people shows a mild negative correlation between the proportion of Cypriots and poverty level in the United States with a correlation coefficient (R) of -0.323 and weighted average of 10.8%. Similarly, the statistical analysis conducted on geographies consisting of 199,808,032 people shows a poor negative correlation between the proportion of Immigrants from Ghana and poverty level in the United States with a correlation coefficient (R) of -0.137 and weighted average of 14.2%, a difference of 30.8%.
Poverty Correlation Summary
| Measurement | Cypriot | Immigrants from Ghana |
| Minimum | 1.4% | 0.71% |
| Maximum | 24.8% | 40.5% |
| Range | 23.5% | 39.8% |
| Mean | 8.7% | 13.4% |
| Median | 7.7% | 12.2% |
| Interquartile 25% (IQ1) | 4.9% | 8.5% |
| Interquartile 75% (IQ3) | 11.4% | 16.6% |
| Interquartile Range (IQR) | 6.5% | 8.1% |
| Standard Deviation (Sample) | 4.9% | 7.6% |
| Standard Deviation (Population) | 4.9% | 7.5% |
Similar Demographics by Poverty
Demographics Similar to Cypriots by Poverty
In terms of poverty, the demographic groups most similar to Cypriots are Tongan (10.8%, a difference of 0.080%), Immigrants from Greece (10.8%, a difference of 0.10%), Immigrants from Poland (10.8%, a difference of 0.12%), Czech (10.8%, a difference of 0.14%), and Macedonian (10.8%, a difference of 0.21%).
| Demographics | Rating | Rank | Poverty |
| Greeks | 99.5 /100 | #29 | Exceptional 10.7% |
| Danes | 99.5 /100 | #30 | Exceptional 10.7% |
| Poles | 99.5 /100 | #31 | Exceptional 10.7% |
| Iranians | 99.5 /100 | #32 | Exceptional 10.7% |
| Macedonians | 99.4 /100 | #33 | Exceptional 10.8% |
| Immigrants | Poland | 99.4 /100 | #34 | Exceptional 10.8% |
| Tongans | 99.4 /100 | #35 | Exceptional 10.8% |
| Cypriots | 99.3 /100 | #36 | Exceptional 10.8% |
| Immigrants | Greece | 99.3 /100 | #37 | Exceptional 10.8% |
| Czechs | 99.3 /100 | #38 | Exceptional 10.8% |
| Immigrants | Pakistan | 99.3 /100 | #39 | Exceptional 10.8% |
| Russians | 99.3 /100 | #40 | Exceptional 10.9% |
| Immigrants | Iran | 99.2 /100 | #41 | Exceptional 10.9% |
| Koreans | 99.2 /100 | #42 | Exceptional 10.9% |
| Immigrants | Singapore | 99.2 /100 | #43 | Exceptional 10.9% |
Demographics Similar to Immigrants from Ghana by Poverty
In terms of poverty, the demographic groups most similar to Immigrants from Ghana are Immigrants from Western Africa (14.1%, a difference of 0.090%), Liberian (14.1%, a difference of 0.11%), Cree (14.2%, a difference of 0.30%), Immigrants from Burma/Myanmar (14.2%, a difference of 0.39%), and Potawatomi (14.1%, a difference of 0.40%).
| Demographics | Rating | Rank | Poverty |
| Ecuadorians | 0.4 /100 | #242 | Tragic 14.0% |
| Sudanese | 0.3 /100 | #243 | Tragic 14.0% |
| Nepalese | 0.3 /100 | #244 | Tragic 14.0% |
| Immigrants | Sudan | 0.3 /100 | #245 | Tragic 14.1% |
| Potawatomi | 0.3 /100 | #246 | Tragic 14.1% |
| Liberians | 0.2 /100 | #247 | Tragic 14.1% |
| Immigrants | Western Africa | 0.2 /100 | #248 | Tragic 14.1% |
| Immigrants | Ghana | 0.2 /100 | #249 | Tragic 14.2% |
| Cree | 0.2 /100 | #250 | Tragic 14.2% |
| Immigrants | Burma/Myanmar | 0.2 /100 | #251 | Tragic 14.2% |
| Spanish American Indians | 0.2 /100 | #252 | Tragic 14.2% |
| Immigrants | Trinidad and Tobago | 0.2 /100 | #253 | Tragic 14.2% |
| Immigrants | El Salvador | 0.1 /100 | #254 | Tragic 14.3% |
| Immigrants | Ecuador | 0.1 /100 | #255 | Tragic 14.3% |
| Mexican American Indians | 0.1 /100 | #256 | Tragic 14.3% |