Immigrants from Jordan vs Immigrants from Ghana Poverty
COMPARE
Immigrants from Jordan
Immigrants from Ghana
Poverty
Poverty Comparison
Immigrants from Jordan
Immigrants from Ghana
11.9%
POVERTY
82.4/ 100
METRIC RATING
138th/ 347
METRIC RANK
14.2%
POVERTY
0.2/ 100
METRIC RATING
249th/ 347
METRIC RANK
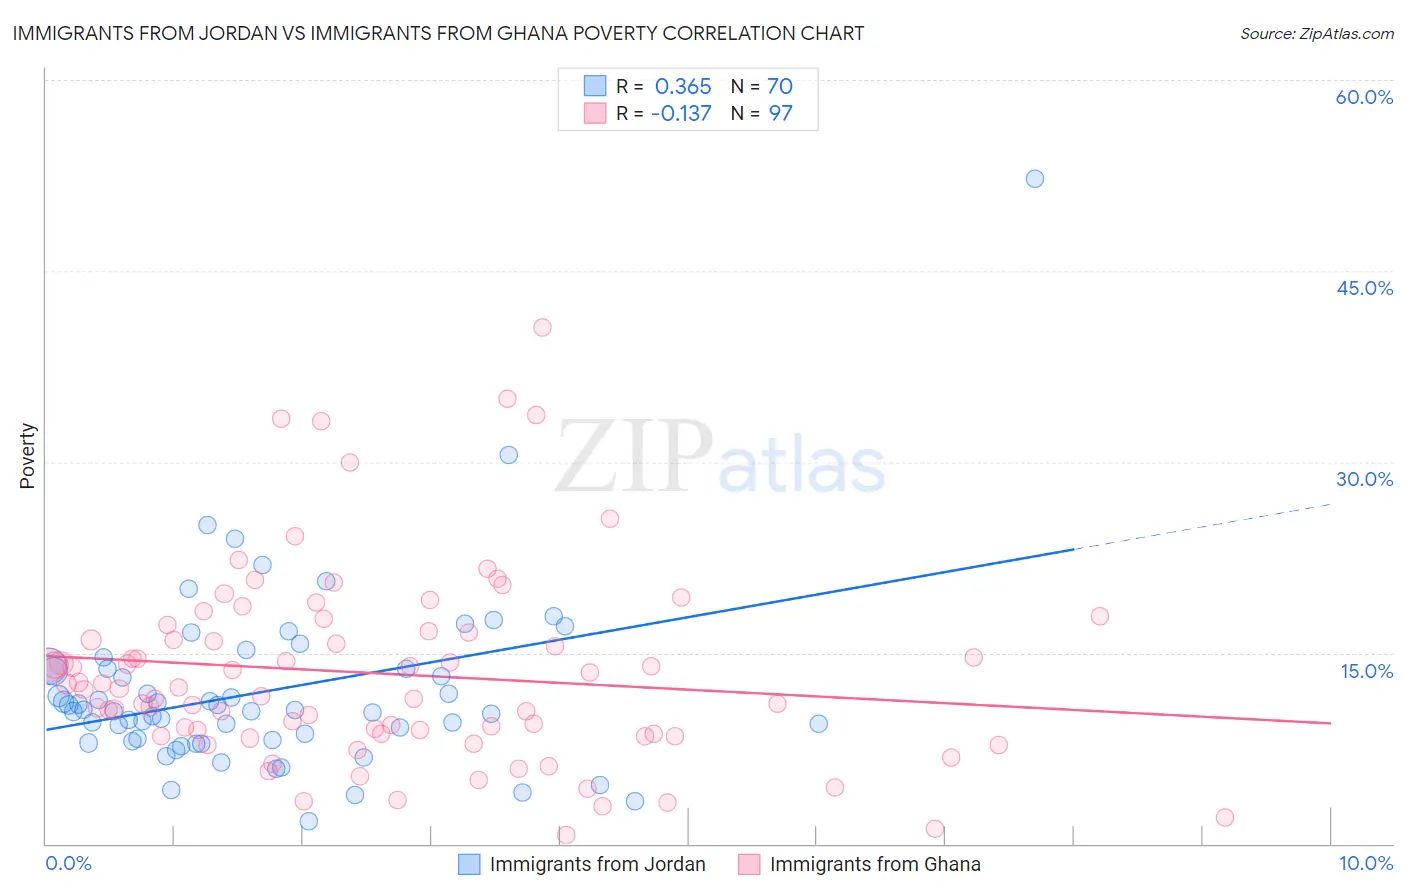
Immigrants from Jordan vs Immigrants from Ghana Poverty Correlation Chart
The statistical analysis conducted on geographies consisting of 181,257,123 people shows a mild positive correlation between the proportion of Immigrants from Jordan and poverty level in the United States with a correlation coefficient (R) of 0.365 and weighted average of 11.9%. Similarly, the statistical analysis conducted on geographies consisting of 199,808,032 people shows a poor negative correlation between the proportion of Immigrants from Ghana and poverty level in the United States with a correlation coefficient (R) of -0.137 and weighted average of 14.2%, a difference of 19.4%.
Poverty Correlation Summary
| Measurement | Immigrants from Jordan | Immigrants from Ghana |
| Minimum | 1.8% | 0.71% |
| Maximum | 52.2% | 40.5% |
| Range | 50.4% | 39.8% |
| Mean | 12.0% | 13.4% |
| Median | 10.5% | 12.2% |
| Interquartile 25% (IQ1) | 8.1% | 8.5% |
| Interquartile 75% (IQ3) | 13.8% | 16.6% |
| Interquartile Range (IQR) | 5.6% | 8.1% |
| Standard Deviation (Sample) | 7.2% | 7.6% |
| Standard Deviation (Population) | 7.1% | 7.5% |
Similar Demographics by Poverty
Demographics Similar to Immigrants from Jordan by Poverty
In terms of poverty, the demographic groups most similar to Immigrants from Jordan are Pakistani (11.9%, a difference of 0.030%), Immigrants from Switzerland (11.8%, a difference of 0.11%), Immigrants from Peru (11.9%, a difference of 0.22%), Immigrants from France (11.9%, a difference of 0.31%), and Chilean (11.8%, a difference of 0.32%).
| Demographics | Rating | Rank | Poverty |
| French | 86.1 /100 | #131 | Excellent 11.8% |
| Peruvians | 85.6 /100 | #132 | Excellent 11.8% |
| Immigrants | Western Europe | 85.2 /100 | #133 | Excellent 11.8% |
| Yugoslavians | 85.2 /100 | #134 | Excellent 11.8% |
| Immigrants | Vietnam | 85.2 /100 | #135 | Excellent 11.8% |
| Chileans | 84.2 /100 | #136 | Excellent 11.8% |
| Immigrants | Switzerland | 83.0 /100 | #137 | Excellent 11.8% |
| Immigrants | Jordan | 82.4 /100 | #138 | Excellent 11.9% |
| Pakistanis | 82.2 /100 | #139 | Excellent 11.9% |
| Immigrants | Peru | 81.1 /100 | #140 | Excellent 11.9% |
| Immigrants | France | 80.5 /100 | #141 | Excellent 11.9% |
| Basques | 80.4 /100 | #142 | Excellent 11.9% |
| Brazilians | 79.7 /100 | #143 | Good 11.9% |
| Icelanders | 77.9 /100 | #144 | Good 11.9% |
| Syrians | 75.1 /100 | #145 | Good 12.0% |
Demographics Similar to Immigrants from Ghana by Poverty
In terms of poverty, the demographic groups most similar to Immigrants from Ghana are Immigrants from Western Africa (14.1%, a difference of 0.090%), Liberian (14.1%, a difference of 0.11%), Cree (14.2%, a difference of 0.30%), Immigrants from Burma/Myanmar (14.2%, a difference of 0.39%), and Potawatomi (14.1%, a difference of 0.40%).
| Demographics | Rating | Rank | Poverty |
| Ecuadorians | 0.4 /100 | #242 | Tragic 14.0% |
| Sudanese | 0.3 /100 | #243 | Tragic 14.0% |
| Nepalese | 0.3 /100 | #244 | Tragic 14.0% |
| Immigrants | Sudan | 0.3 /100 | #245 | Tragic 14.1% |
| Potawatomi | 0.3 /100 | #246 | Tragic 14.1% |
| Liberians | 0.2 /100 | #247 | Tragic 14.1% |
| Immigrants | Western Africa | 0.2 /100 | #248 | Tragic 14.1% |
| Immigrants | Ghana | 0.2 /100 | #249 | Tragic 14.2% |
| Cree | 0.2 /100 | #250 | Tragic 14.2% |
| Immigrants | Burma/Myanmar | 0.2 /100 | #251 | Tragic 14.2% |
| Spanish American Indians | 0.2 /100 | #252 | Tragic 14.2% |
| Immigrants | Trinidad and Tobago | 0.2 /100 | #253 | Tragic 14.2% |
| Immigrants | El Salvador | 0.1 /100 | #254 | Tragic 14.3% |
| Immigrants | Ecuador | 0.1 /100 | #255 | Tragic 14.3% |
| Mexican American Indians | 0.1 /100 | #256 | Tragic 14.3% |