Immigrants from Eastern Europe vs Immigrants from Ghana Poverty
COMPARE
Immigrants from Eastern Europe
Immigrants from Ghana
Poverty
Poverty Comparison
Immigrants from Eastern Europe
Immigrants from Ghana
11.3%
POVERTY
97.0/ 100
METRIC RATING
75th/ 347
METRIC RANK
14.2%
POVERTY
0.2/ 100
METRIC RATING
249th/ 347
METRIC RANK
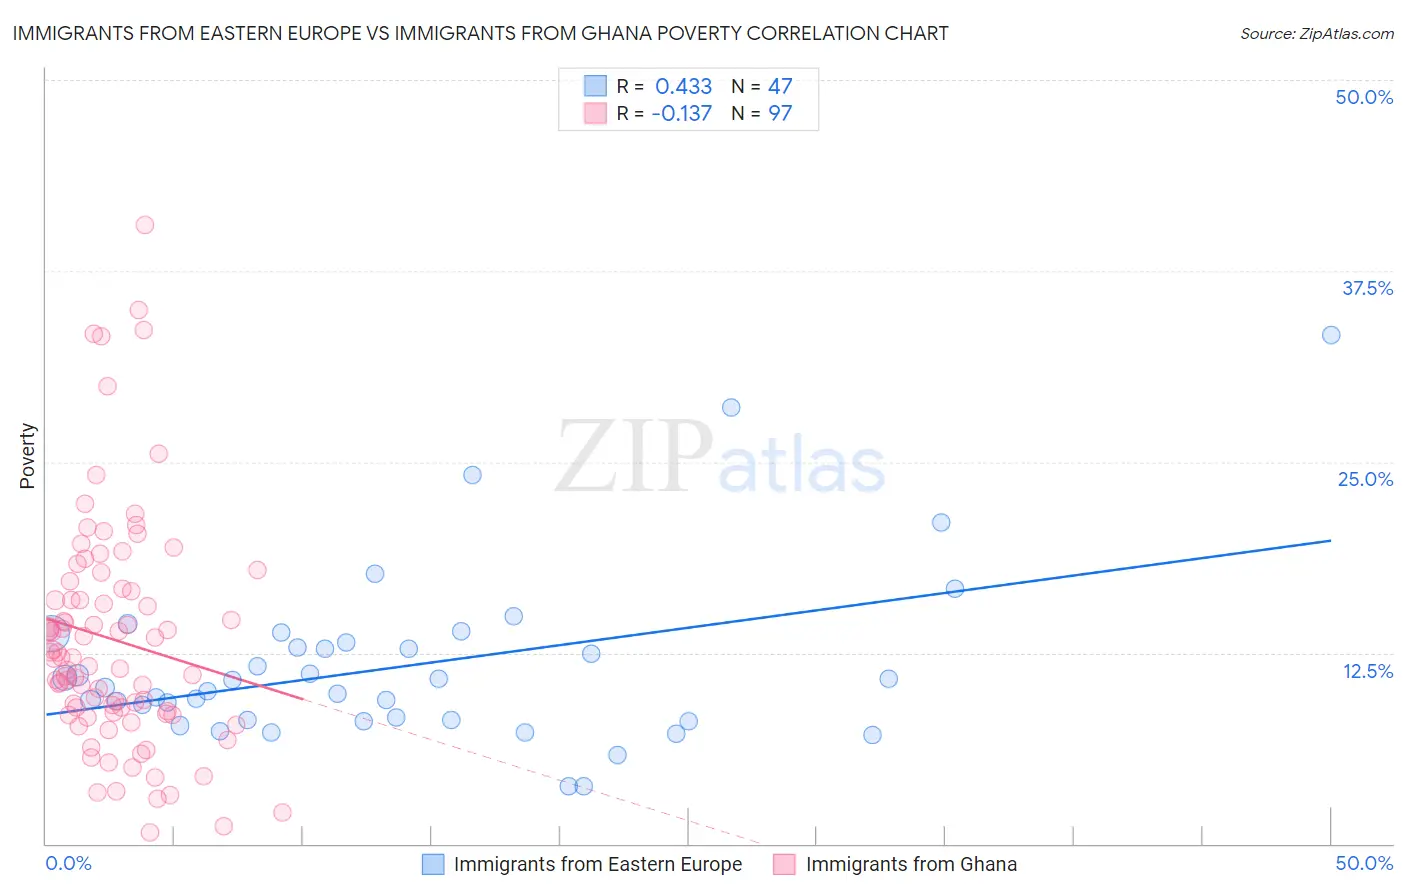
Immigrants from Eastern Europe vs Immigrants from Ghana Poverty Correlation Chart
The statistical analysis conducted on geographies consisting of 475,463,509 people shows a moderate positive correlation between the proportion of Immigrants from Eastern Europe and poverty level in the United States with a correlation coefficient (R) of 0.433 and weighted average of 11.3%. Similarly, the statistical analysis conducted on geographies consisting of 199,808,032 people shows a poor negative correlation between the proportion of Immigrants from Ghana and poverty level in the United States with a correlation coefficient (R) of -0.137 and weighted average of 14.2%, a difference of 25.5%.
Poverty Correlation Summary
| Measurement | Immigrants from Eastern Europe | Immigrants from Ghana |
| Minimum | 3.8% | 0.71% |
| Maximum | 33.3% | 40.5% |
| Range | 29.6% | 39.8% |
| Mean | 11.6% | 13.4% |
| Median | 10.2% | 12.2% |
| Interquartile 25% (IQ1) | 8.1% | 8.5% |
| Interquartile 75% (IQ3) | 13.2% | 16.6% |
| Interquartile Range (IQR) | 5.1% | 8.1% |
| Standard Deviation (Sample) | 5.7% | 7.6% |
| Standard Deviation (Population) | 5.6% | 7.5% |
Similar Demographics by Poverty
Demographics Similar to Immigrants from Eastern Europe by Poverty
In terms of poverty, the demographic groups most similar to Immigrants from Eastern Europe are Immigrants from North America (11.3%, a difference of 0.15%), Carpatho Rusyn (11.3%, a difference of 0.19%), Immigrants from Eastern Asia (11.3%, a difference of 0.22%), European (11.3%, a difference of 0.24%), and Immigrants from Belgium (11.3%, a difference of 0.24%).
| Demographics | Rating | Rank | Poverty |
| Slovaks | 97.4 /100 | #68 | Exceptional 11.2% |
| Serbians | 97.4 /100 | #69 | Exceptional 11.2% |
| Immigrants | Canada | 97.3 /100 | #70 | Exceptional 11.3% |
| Zimbabweans | 97.3 /100 | #71 | Exceptional 11.3% |
| Europeans | 97.2 /100 | #72 | Exceptional 11.3% |
| Immigrants | Belgium | 97.2 /100 | #73 | Exceptional 11.3% |
| Carpatho Rusyns | 97.2 /100 | #74 | Exceptional 11.3% |
| Immigrants | Eastern Europe | 97.0 /100 | #75 | Exceptional 11.3% |
| Immigrants | North America | 96.8 /100 | #76 | Exceptional 11.3% |
| Immigrants | Eastern Asia | 96.7 /100 | #77 | Exceptional 11.3% |
| Dutch | 96.7 /100 | #78 | Exceptional 11.3% |
| Cambodians | 96.7 /100 | #79 | Exceptional 11.3% |
| Indians (Asian) | 96.6 /100 | #80 | Exceptional 11.3% |
| Irish | 96.6 /100 | #81 | Exceptional 11.3% |
| Egyptians | 96.5 /100 | #82 | Exceptional 11.3% |
Demographics Similar to Immigrants from Ghana by Poverty
In terms of poverty, the demographic groups most similar to Immigrants from Ghana are Immigrants from Western Africa (14.1%, a difference of 0.090%), Liberian (14.1%, a difference of 0.11%), Cree (14.2%, a difference of 0.30%), Immigrants from Burma/Myanmar (14.2%, a difference of 0.39%), and Potawatomi (14.1%, a difference of 0.40%).
| Demographics | Rating | Rank | Poverty |
| Ecuadorians | 0.4 /100 | #242 | Tragic 14.0% |
| Sudanese | 0.3 /100 | #243 | Tragic 14.0% |
| Nepalese | 0.3 /100 | #244 | Tragic 14.0% |
| Immigrants | Sudan | 0.3 /100 | #245 | Tragic 14.1% |
| Potawatomi | 0.3 /100 | #246 | Tragic 14.1% |
| Liberians | 0.2 /100 | #247 | Tragic 14.1% |
| Immigrants | Western Africa | 0.2 /100 | #248 | Tragic 14.1% |
| Immigrants | Ghana | 0.2 /100 | #249 | Tragic 14.2% |
| Cree | 0.2 /100 | #250 | Tragic 14.2% |
| Immigrants | Burma/Myanmar | 0.2 /100 | #251 | Tragic 14.2% |
| Spanish American Indians | 0.2 /100 | #252 | Tragic 14.2% |
| Immigrants | Trinidad and Tobago | 0.2 /100 | #253 | Tragic 14.2% |
| Immigrants | El Salvador | 0.1 /100 | #254 | Tragic 14.3% |
| Immigrants | Ecuador | 0.1 /100 | #255 | Tragic 14.3% |
| Mexican American Indians | 0.1 /100 | #256 | Tragic 14.3% |