South American Indian vs Immigrants from Ghana Poverty
COMPARE
South American Indian
Immigrants from Ghana
Poverty
Poverty Comparison
South American Indians
Immigrants from Ghana
12.7%
POVERTY
23.3/ 100
METRIC RATING
192nd/ 347
METRIC RANK
14.2%
POVERTY
0.2/ 100
METRIC RATING
249th/ 347
METRIC RANK
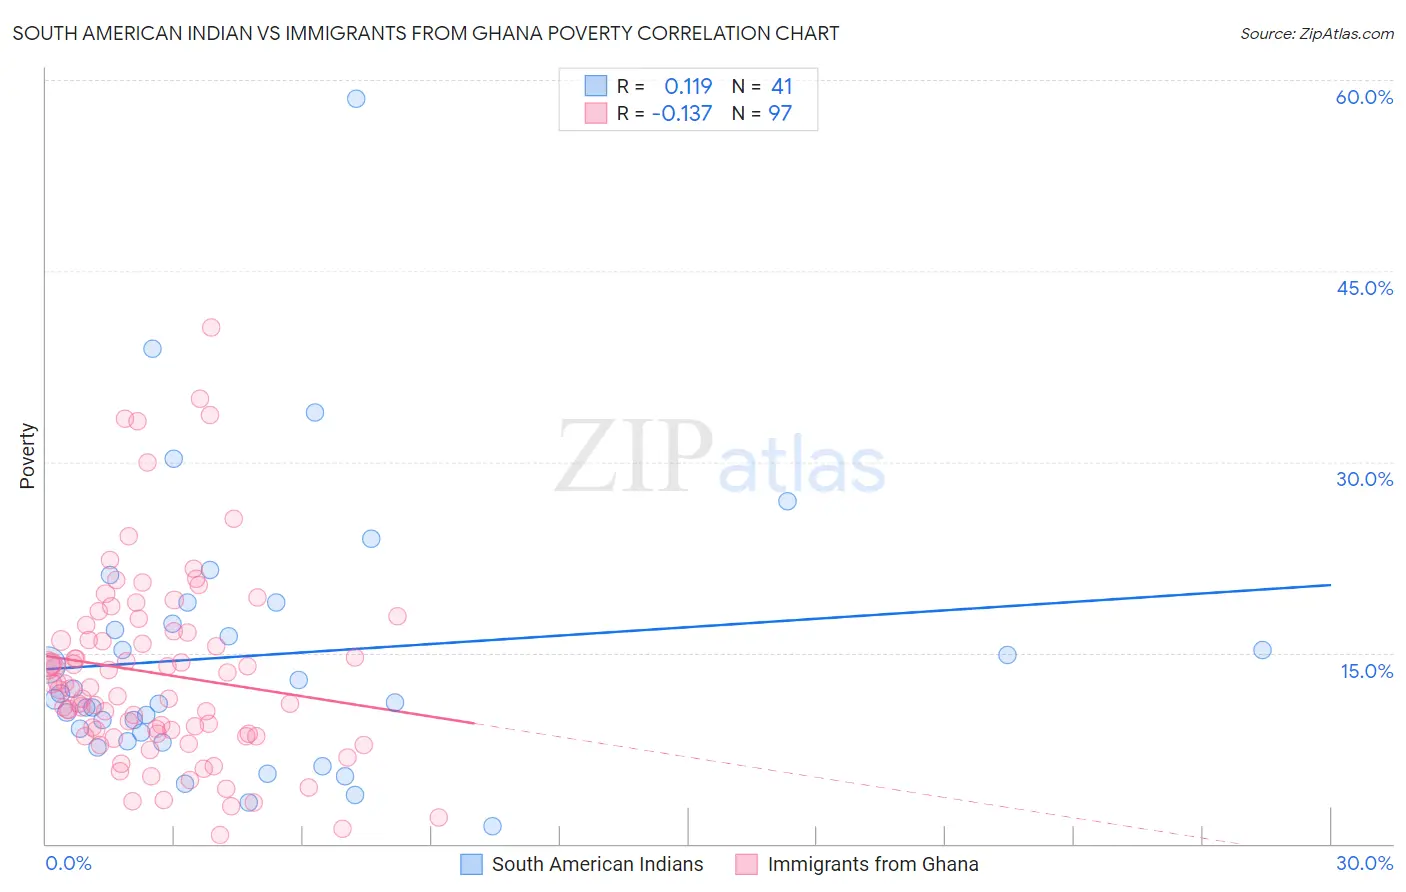
South American Indian vs Immigrants from Ghana Poverty Correlation Chart
The statistical analysis conducted on geographies consisting of 164,528,335 people shows a poor positive correlation between the proportion of South American Indians and poverty level in the United States with a correlation coefficient (R) of 0.119 and weighted average of 12.7%. Similarly, the statistical analysis conducted on geographies consisting of 199,808,032 people shows a poor negative correlation between the proportion of Immigrants from Ghana and poverty level in the United States with a correlation coefficient (R) of -0.137 and weighted average of 14.2%, a difference of 11.7%.
Poverty Correlation Summary
| Measurement | South American Indian | Immigrants from Ghana |
| Minimum | 1.4% | 0.71% |
| Maximum | 58.5% | 40.5% |
| Range | 57.1% | 39.8% |
| Mean | 14.8% | 13.4% |
| Median | 11.4% | 12.2% |
| Interquartile 25% (IQ1) | 8.4% | 8.5% |
| Interquartile 75% (IQ3) | 18.2% | 16.6% |
| Interquartile Range (IQR) | 9.8% | 8.1% |
| Standard Deviation (Sample) | 10.8% | 7.6% |
| Standard Deviation (Population) | 10.6% | 7.5% |
Similar Demographics by Poverty
Demographics Similar to South American Indians by Poverty
In terms of poverty, the demographic groups most similar to South American Indians are Delaware (12.7%, a difference of 0.25%), Arab (12.7%, a difference of 0.29%), Immigrants from Kuwait (12.7%, a difference of 0.33%), Iraqi (12.7%, a difference of 0.34%), and Immigrants from Lebanon (12.8%, a difference of 0.65%).
| Demographics | Rating | Rank | Poverty |
| Israelis | 36.4 /100 | #185 | Fair 12.5% |
| Immigrants | Sierra Leone | 36.3 /100 | #186 | Fair 12.5% |
| Hawaiians | 34.1 /100 | #187 | Fair 12.5% |
| Immigrants | Costa Rica | 33.3 /100 | #188 | Fair 12.5% |
| Aleuts | 33.2 /100 | #189 | Fair 12.5% |
| Immigrants | South America | 32.3 /100 | #190 | Fair 12.5% |
| Sierra Leoneans | 31.5 /100 | #191 | Fair 12.6% |
| South American Indians | 23.3 /100 | #192 | Fair 12.7% |
| Delaware | 21.4 /100 | #193 | Fair 12.7% |
| Arabs | 21.1 /100 | #194 | Fair 12.7% |
| Immigrants | Kuwait | 20.9 /100 | #195 | Fair 12.7% |
| Iraqis | 20.8 /100 | #196 | Fair 12.7% |
| Immigrants | Lebanon | 18.7 /100 | #197 | Poor 12.8% |
| Spanish | 18.7 /100 | #198 | Poor 12.8% |
| Immigrants | Kenya | 17.5 /100 | #199 | Poor 12.8% |
Demographics Similar to Immigrants from Ghana by Poverty
In terms of poverty, the demographic groups most similar to Immigrants from Ghana are Immigrants from Western Africa (14.1%, a difference of 0.090%), Liberian (14.1%, a difference of 0.11%), Cree (14.2%, a difference of 0.30%), Immigrants from Burma/Myanmar (14.2%, a difference of 0.39%), and Potawatomi (14.1%, a difference of 0.40%).
| Demographics | Rating | Rank | Poverty |
| Ecuadorians | 0.4 /100 | #242 | Tragic 14.0% |
| Sudanese | 0.3 /100 | #243 | Tragic 14.0% |
| Nepalese | 0.3 /100 | #244 | Tragic 14.0% |
| Immigrants | Sudan | 0.3 /100 | #245 | Tragic 14.1% |
| Potawatomi | 0.3 /100 | #246 | Tragic 14.1% |
| Liberians | 0.2 /100 | #247 | Tragic 14.1% |
| Immigrants | Western Africa | 0.2 /100 | #248 | Tragic 14.1% |
| Immigrants | Ghana | 0.2 /100 | #249 | Tragic 14.2% |
| Cree | 0.2 /100 | #250 | Tragic 14.2% |
| Immigrants | Burma/Myanmar | 0.2 /100 | #251 | Tragic 14.2% |
| Spanish American Indians | 0.2 /100 | #252 | Tragic 14.2% |
| Immigrants | Trinidad and Tobago | 0.2 /100 | #253 | Tragic 14.2% |
| Immigrants | El Salvador | 0.1 /100 | #254 | Tragic 14.3% |
| Immigrants | Ecuador | 0.1 /100 | #255 | Tragic 14.3% |
| Mexican American Indians | 0.1 /100 | #256 | Tragic 14.3% |