Hopi vs Trinidadian and Tobagonian In Labor Force | Age 20-24
COMPARE
Hopi
Trinidadian and Tobagonian
In Labor Force | Age 20-24
In Labor Force | Age 20-24 Comparison
Hopi
Trinidadians and Tobagonians
66.0%
IN LABOR FORCE | AGE 20-24
0.0/ 100
METRIC RATING
345th/ 347
METRIC RANK
71.5%
IN LABOR FORCE | AGE 20-24
0.0/ 100
METRIC RATING
320th/ 347
METRIC RANK
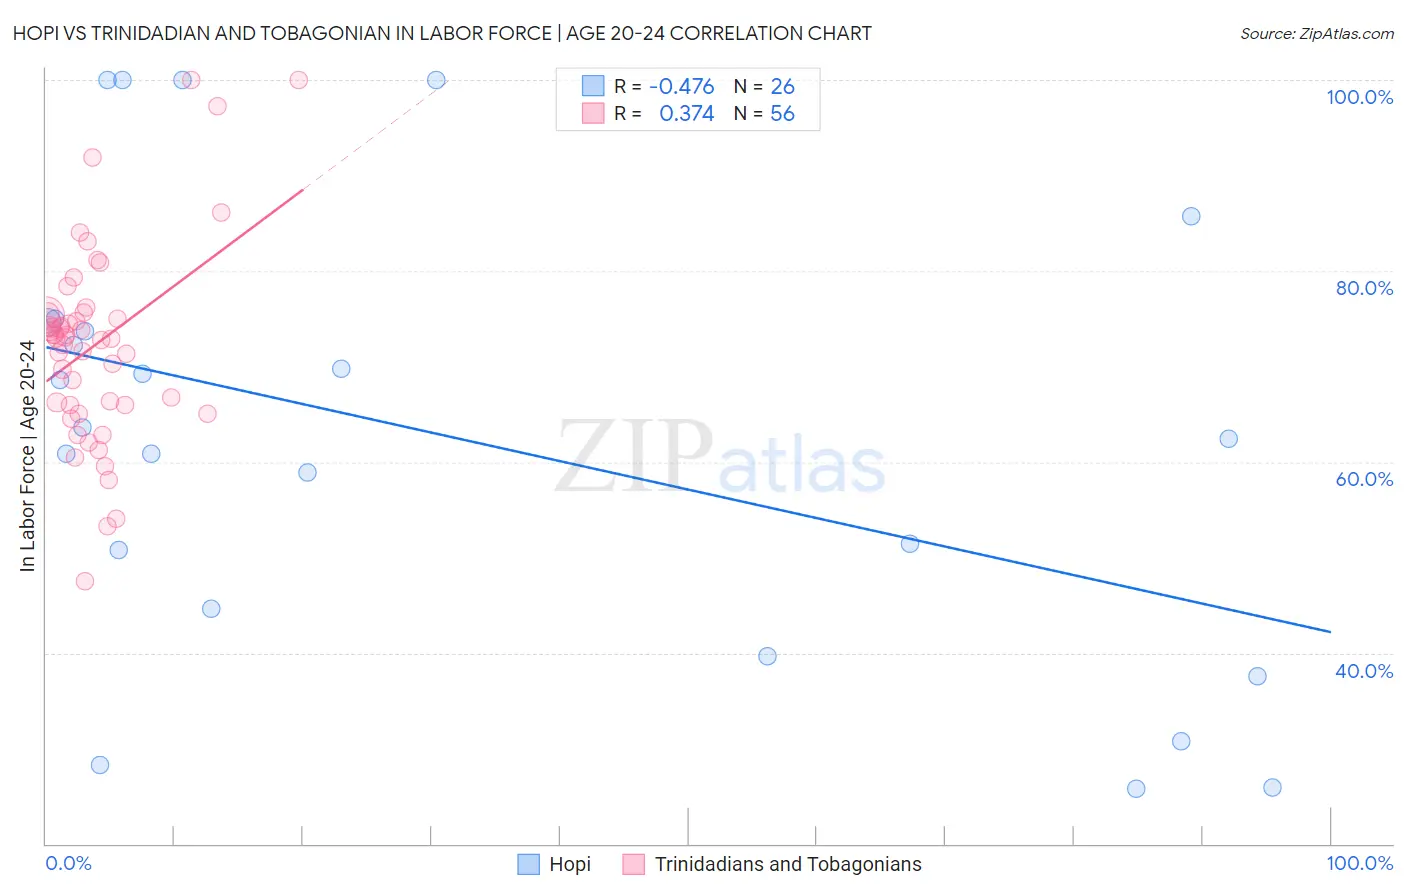
Hopi vs Trinidadian and Tobagonian In Labor Force | Age 20-24 Correlation Chart
The statistical analysis conducted on geographies consisting of 74,726,569 people shows a moderate negative correlation between the proportion of Hopi and labor force participation rate among population between the ages 20 and 24 in the United States with a correlation coefficient (R) of -0.476 and weighted average of 66.0%. Similarly, the statistical analysis conducted on geographies consisting of 219,866,832 people shows a mild positive correlation between the proportion of Trinidadians and Tobagonians and labor force participation rate among population between the ages 20 and 24 in the United States with a correlation coefficient (R) of 0.374 and weighted average of 71.5%, a difference of 8.3%.
In Labor Force | Age 20-24 Correlation Summary
| Measurement | Hopi | Trinidadian and Tobagonian |
| Minimum | 25.7% | 47.5% |
| Maximum | 100.0% | 100.0% |
| Range | 74.3% | 52.5% |
| Mean | 62.7% | 72.3% |
| Median | 63.0% | 73.0% |
| Interquartile 25% (IQ1) | 44.6% | 66.0% |
| Interquartile 75% (IQ3) | 74.6% | 75.4% |
| Interquartile Range (IQR) | 30.0% | 9.4% |
| Standard Deviation (Sample) | 23.2% | 10.4% |
| Standard Deviation (Population) | 22.7% | 10.3% |
Similar Demographics by In Labor Force | Age 20-24
Demographics Similar to Hopi by In Labor Force | Age 20-24
In terms of in labor force | age 20-24, the demographic groups most similar to Hopi are Lumbee (65.5%, a difference of 0.79%), Immigrants from Grenada (67.2%, a difference of 1.7%), Navajo (64.8%, a difference of 1.8%), Puerto Rican (68.3%, a difference of 3.5%), and Immigrants from St. Vincent and the Grenadines (68.4%, a difference of 3.6%).
| Demographics | Rating | Rank | In Labor Force | Age 20-24 |
| Yuman | 0.0 /100 | #333 | Tragic 70.3% |
| British West Indians | 0.0 /100 | #334 | Tragic 70.0% |
| Immigrants | Barbados | 0.0 /100 | #335 | Tragic 69.7% |
| Immigrants | Guyana | 0.0 /100 | #336 | Tragic 69.3% |
| Guyanese | 0.0 /100 | #337 | Tragic 69.2% |
| Pima | 0.0 /100 | #338 | Tragic 69.0% |
| Immigrants | Yemen | 0.0 /100 | #339 | Tragic 68.9% |
| Menominee | 0.0 /100 | #340 | Tragic 68.7% |
| Tohono O'odham | 0.0 /100 | #341 | Tragic 68.6% |
| Immigrants | St. Vincent and the Grenadines | 0.0 /100 | #342 | Tragic 68.4% |
| Puerto Ricans | 0.0 /100 | #343 | Tragic 68.3% |
| Immigrants | Grenada | 0.0 /100 | #344 | Tragic 67.2% |
| Hopi | 0.0 /100 | #345 | Tragic 66.0% |
| Lumbee | 0.0 /100 | #346 | Tragic 65.5% |
| Navajo | 0.0 /100 | #347 | Tragic 64.8% |
Demographics Similar to Trinidadians and Tobagonians by In Labor Force | Age 20-24
In terms of in labor force | age 20-24, the demographic groups most similar to Trinidadians and Tobagonians are Immigrants from Taiwan (71.5%, a difference of 0.050%), Immigrants from Israel (71.6%, a difference of 0.080%), Immigrants from Hong Kong (71.6%, a difference of 0.11%), Filipino (71.4%, a difference of 0.18%), and Immigrants from Armenia (71.7%, a difference of 0.20%).
| Demographics | Rating | Rank | In Labor Force | Age 20-24 |
| Immigrants | Dominica | 0.0 /100 | #313 | Tragic 71.9% |
| Indians (Asian) | 0.0 /100 | #314 | Tragic 71.9% |
| Immigrants | Iran | 0.0 /100 | #315 | Tragic 71.8% |
| Immigrants | Eastern Asia | 0.0 /100 | #316 | Tragic 71.8% |
| Immigrants | Armenia | 0.0 /100 | #317 | Tragic 71.7% |
| Immigrants | Hong Kong | 0.0 /100 | #318 | Tragic 71.6% |
| Immigrants | Israel | 0.0 /100 | #319 | Tragic 71.6% |
| Trinidadians and Tobagonians | 0.0 /100 | #320 | Tragic 71.5% |
| Immigrants | Taiwan | 0.0 /100 | #321 | Tragic 71.5% |
| Filipinos | 0.0 /100 | #322 | Tragic 71.4% |
| West Indians | 0.0 /100 | #323 | Tragic 71.3% |
| Immigrants | Dominican Republic | 0.0 /100 | #324 | Tragic 71.2% |
| Barbadians | 0.0 /100 | #325 | Tragic 71.1% |
| Dominicans | 0.0 /100 | #326 | Tragic 71.1% |
| Immigrants | Trinidad and Tobago | 0.0 /100 | #327 | Tragic 71.1% |