Immigrants from Sudan vs Immigrants from Italy Single Female Poverty
COMPARE
Immigrants from Sudan
Immigrants from Italy
Single Female Poverty
Single Female Poverty Comparison
Immigrants from Sudan
Immigrants from Italy
22.6%
SINGLE FEMALE POVERTY
0.8/ 100
METRIC RATING
255th/ 347
METRIC RANK
19.0%
SINGLE FEMALE POVERTY
99.8/ 100
METRIC RATING
51st/ 347
METRIC RANK
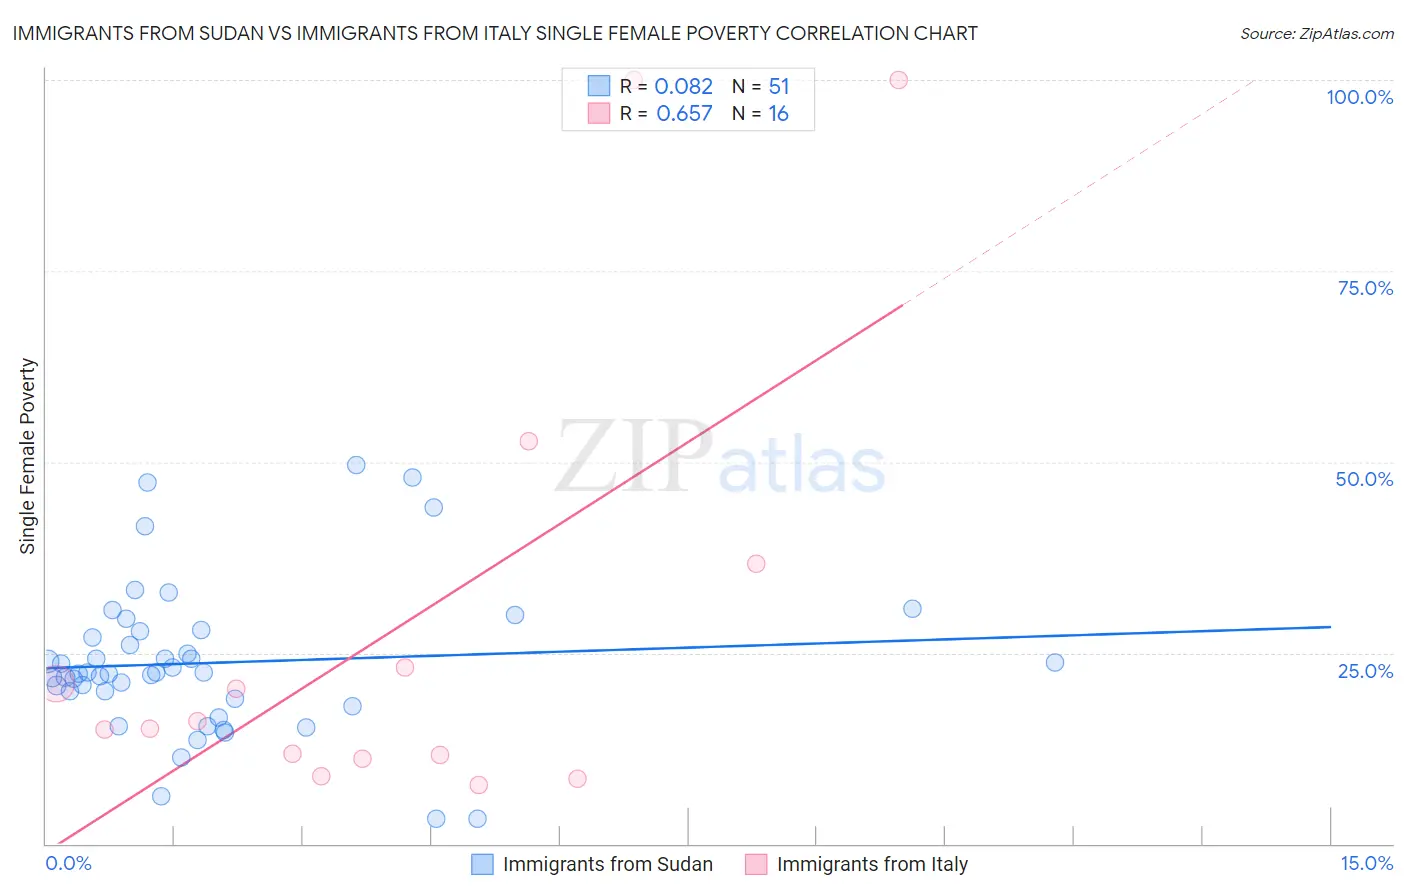
Immigrants from Sudan vs Immigrants from Italy Single Female Poverty Correlation Chart
The statistical analysis conducted on geographies consisting of 118,406,629 people shows a slight positive correlation between the proportion of Immigrants from Sudan and poverty level among single females in the United States with a correlation coefficient (R) of 0.082 and weighted average of 22.6%. Similarly, the statistical analysis conducted on geographies consisting of 318,580,979 people shows a significant positive correlation between the proportion of Immigrants from Italy and poverty level among single females in the United States with a correlation coefficient (R) of 0.657 and weighted average of 19.0%, a difference of 18.4%.
Single Female Poverty Correlation Summary
| Measurement | Immigrants from Sudan | Immigrants from Italy |
| Minimum | 3.2% | 7.7% |
| Maximum | 49.6% | 100.0% |
| Range | 46.4% | 92.3% |
| Mean | 23.7% | 28.7% |
| Median | 22.4% | 15.6% |
| Interquartile 25% (IQ1) | 19.0% | 11.4% |
| Interquartile 75% (IQ3) | 27.8% | 29.9% |
| Interquartile Range (IQR) | 8.8% | 18.5% |
| Standard Deviation (Sample) | 9.9% | 30.1% |
| Standard Deviation (Population) | 9.8% | 29.2% |
Similar Demographics by Single Female Poverty
Demographics Similar to Immigrants from Sudan by Single Female Poverty
In terms of single female poverty, the demographic groups most similar to Immigrants from Sudan are Immigrants from Burma/Myanmar (22.6%, a difference of 0.0%), Immigrants from Liberia (22.5%, a difference of 0.10%), Immigrants from Belize (22.6%, a difference of 0.14%), Delaware (22.5%, a difference of 0.19%), and Sudanese (22.6%, a difference of 0.29%).
| Demographics | Rating | Rank | Single Female Poverty |
| Belizeans | 1.4 /100 | #248 | Tragic 22.4% |
| Immigrants | Caribbean | 1.3 /100 | #249 | Tragic 22.4% |
| Immigrants | Bahamas | 1.2 /100 | #250 | Tragic 22.5% |
| Immigrants | West Indies | 1.0 /100 | #251 | Tragic 22.5% |
| Delaware | 1.0 /100 | #252 | Tragic 22.5% |
| Immigrants | Liberia | 0.9 /100 | #253 | Tragic 22.5% |
| Immigrants | Burma/Myanmar | 0.8 /100 | #254 | Tragic 22.6% |
| Immigrants | Sudan | 0.8 /100 | #255 | Tragic 22.6% |
| Immigrants | Belize | 0.8 /100 | #256 | Tragic 22.6% |
| Sudanese | 0.7 /100 | #257 | Tragic 22.6% |
| Bahamians | 0.6 /100 | #258 | Tragic 22.7% |
| Whites/Caucasians | 0.6 /100 | #259 | Tragic 22.7% |
| Celtics | 0.5 /100 | #260 | Tragic 22.7% |
| Immigrants | Cabo Verde | 0.4 /100 | #261 | Tragic 22.8% |
| British West Indians | 0.4 /100 | #262 | Tragic 22.8% |
Demographics Similar to Immigrants from Italy by Single Female Poverty
In terms of single female poverty, the demographic groups most similar to Immigrants from Italy are Immigrants from Eastern Europe (19.0%, a difference of 0.040%), Egyptian (19.1%, a difference of 0.040%), Immigrants from Czechoslovakia (19.0%, a difference of 0.080%), Immigrants from Argentina (19.0%, a difference of 0.090%), and Tsimshian (19.1%, a difference of 0.25%).
| Demographics | Rating | Rank | Single Female Poverty |
| Immigrants | Croatia | 99.9 /100 | #44 | Exceptional 18.9% |
| Immigrants | Indonesia | 99.8 /100 | #45 | Exceptional 18.9% |
| Macedonians | 99.8 /100 | #46 | Exceptional 18.9% |
| Latvians | 99.8 /100 | #47 | Exceptional 19.0% |
| Immigrants | Argentina | 99.8 /100 | #48 | Exceptional 19.0% |
| Immigrants | Czechoslovakia | 99.8 /100 | #49 | Exceptional 19.0% |
| Immigrants | Eastern Europe | 99.8 /100 | #50 | Exceptional 19.0% |
| Immigrants | Italy | 99.8 /100 | #51 | Exceptional 19.0% |
| Egyptians | 99.7 /100 | #52 | Exceptional 19.1% |
| Tsimshian | 99.7 /100 | #53 | Exceptional 19.1% |
| Argentineans | 99.7 /100 | #54 | Exceptional 19.1% |
| Immigrants | Vietnam | 99.7 /100 | #55 | Exceptional 19.1% |
| Immigrants | Fiji | 99.7 /100 | #56 | Exceptional 19.1% |
| Eastern Europeans | 99.7 /100 | #57 | Exceptional 19.1% |
| Immigrants | Bulgaria | 99.7 /100 | #58 | Exceptional 19.1% |