Guyanese vs Immigrants from Zaire Unemployment Among Ages 30 to 34 years
COMPARE
Guyanese
Immigrants from Zaire
Unemployment Among Ages 30 to 34 years
Unemployment Among Ages 30 to 34 years Comparison
Guyanese
Immigrants from Zaire
7.2%
UNEMPLOYMENT AMONG AGES 30 TO 34 YEARS
0.0/ 100
METRIC RATING
319th/ 347
METRIC RANK
5.0%
UNEMPLOYMENT AMONG AGES 30 TO 34 YEARS
99.3/ 100
METRIC RATING
32nd/ 347
METRIC RANK
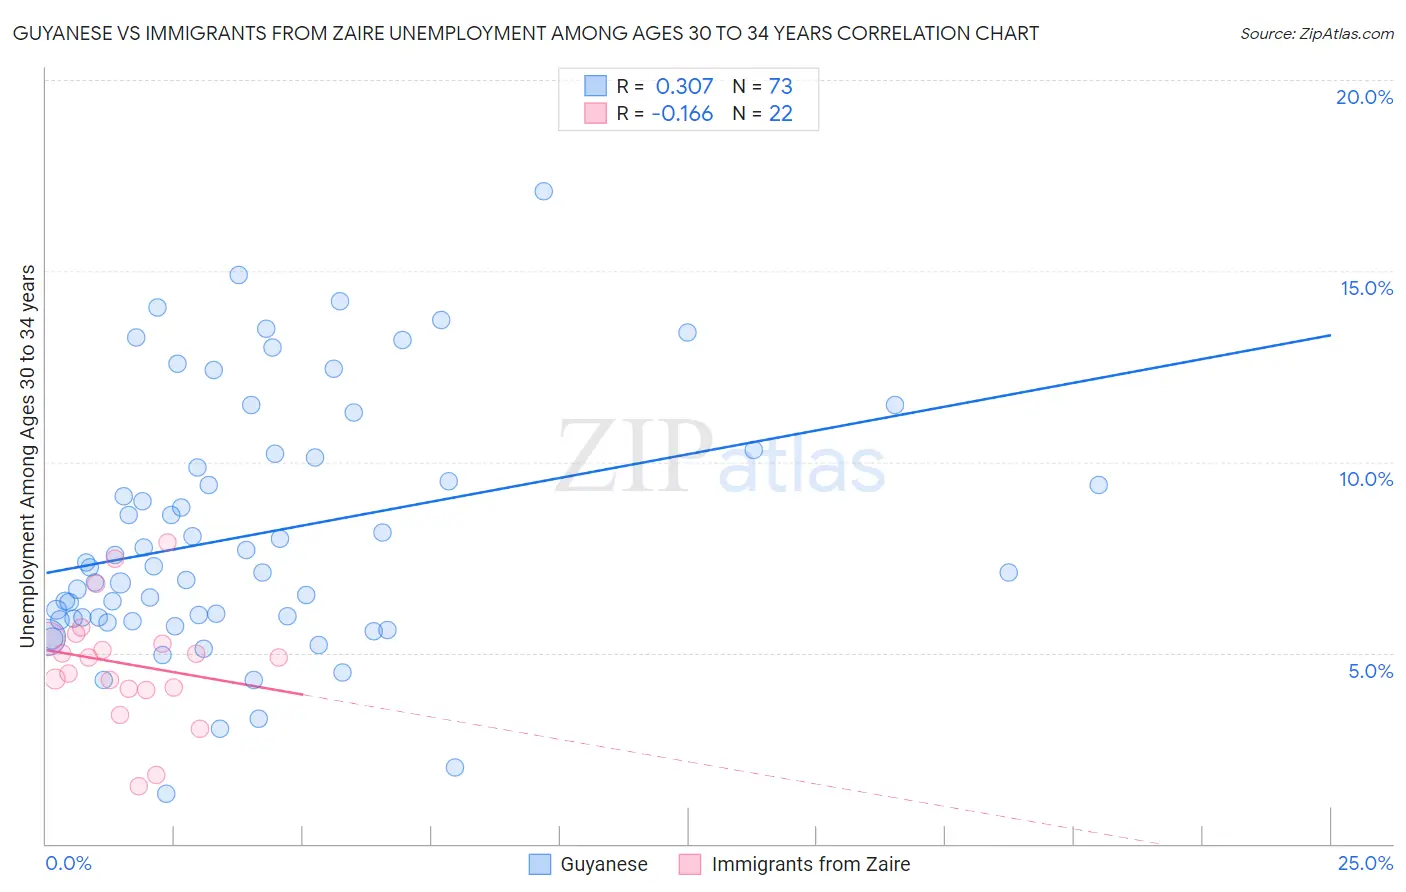
Guyanese vs Immigrants from Zaire Unemployment Among Ages 30 to 34 years Correlation Chart
The statistical analysis conducted on geographies consisting of 172,436,836 people shows a mild positive correlation between the proportion of Guyanese and unemployment rate among population between the ages 30 and 34 in the United States with a correlation coefficient (R) of 0.307 and weighted average of 7.2%. Similarly, the statistical analysis conducted on geographies consisting of 105,959,857 people shows a poor negative correlation between the proportion of Immigrants from Zaire and unemployment rate among population between the ages 30 and 34 in the United States with a correlation coefficient (R) of -0.166 and weighted average of 5.0%, a difference of 44.0%.
Unemployment Among Ages 30 to 34 years Correlation Summary
| Measurement | Guyanese | Immigrants from Zaire |
| Minimum | 1.3% | 1.5% |
| Maximum | 17.1% | 7.9% |
| Range | 15.8% | 6.4% |
| Mean | 8.1% | 4.7% |
| Median | 7.2% | 4.9% |
| Interquartile 25% (IQ1) | 5.9% | 4.0% |
| Interquartile 75% (IQ3) | 10.2% | 5.4% |
| Interquartile Range (IQR) | 4.3% | 1.3% |
| Standard Deviation (Sample) | 3.3% | 1.5% |
| Standard Deviation (Population) | 3.3% | 1.5% |
Similar Demographics by Unemployment Among Ages 30 to 34 years
Demographics Similar to Guyanese by Unemployment Among Ages 30 to 34 years
In terms of unemployment among ages 30 to 34 years, the demographic groups most similar to Guyanese are Cape Verdean (7.2%, a difference of 0.020%), Black/African American (7.2%, a difference of 0.060%), Immigrants from Cabo Verde (7.2%, a difference of 0.16%), Immigrants from Guyana (7.2%, a difference of 0.31%), and Houma (7.2%, a difference of 0.43%).
| Demographics | Rating | Rank | Unemployment Among Ages 30 to 34 years |
| British West Indians | 0.0 /100 | #312 | Tragic 7.0% |
| Ute | 0.0 /100 | #313 | Tragic 7.0% |
| Lumbee | 0.0 /100 | #314 | Tragic 7.1% |
| Aleuts | 0.0 /100 | #315 | Tragic 7.1% |
| Houma | 0.0 /100 | #316 | Tragic 7.2% |
| Immigrants | Cabo Verde | 0.0 /100 | #317 | Tragic 7.2% |
| Blacks/African Americans | 0.0 /100 | #318 | Tragic 7.2% |
| Guyanese | 0.0 /100 | #319 | Tragic 7.2% |
| Cape Verdeans | 0.0 /100 | #320 | Tragic 7.2% |
| Immigrants | Guyana | 0.0 /100 | #321 | Tragic 7.2% |
| Marshallese | 0.0 /100 | #322 | Tragic 7.2% |
| Immigrants | Yemen | 0.0 /100 | #323 | Tragic 7.3% |
| Immigrants | Dominica | 0.0 /100 | #324 | Tragic 7.3% |
| Apache | 0.0 /100 | #325 | Tragic 7.3% |
| Dominicans | 0.0 /100 | #326 | Tragic 7.7% |
Demographics Similar to Immigrants from Zaire by Unemployment Among Ages 30 to 34 years
In terms of unemployment among ages 30 to 34 years, the demographic groups most similar to Immigrants from Zaire are Somali (5.0%, a difference of 0.040%), Immigrants from Saudi Arabia (5.0%, a difference of 0.10%), Norwegian (5.0%, a difference of 0.13%), Latvian (5.0%, a difference of 0.14%), and German Russian (5.0%, a difference of 0.15%).
| Demographics | Rating | Rank | Unemployment Among Ages 30 to 34 years |
| Immigrants | Singapore | 99.5 /100 | #25 | Exceptional 5.0% |
| Immigrants | Kuwait | 99.5 /100 | #26 | Exceptional 5.0% |
| Danes | 99.5 /100 | #27 | Exceptional 5.0% |
| Immigrants | Cuba | 99.4 /100 | #28 | Exceptional 5.0% |
| German Russians | 99.4 /100 | #29 | Exceptional 5.0% |
| Norwegians | 99.4 /100 | #30 | Exceptional 5.0% |
| Somalis | 99.3 /100 | #31 | Exceptional 5.0% |
| Immigrants | Zaire | 99.3 /100 | #32 | Exceptional 5.0% |
| Immigrants | Saudi Arabia | 99.3 /100 | #33 | Exceptional 5.0% |
| Latvians | 99.3 /100 | #34 | Exceptional 5.0% |
| Immigrants | Ethiopia | 99.2 /100 | #35 | Exceptional 5.0% |
| Czechs | 99.2 /100 | #36 | Exceptional 5.0% |
| Immigrants | Turkey | 99.0 /100 | #37 | Exceptional 5.0% |
| Sri Lankans | 99.0 /100 | #38 | Exceptional 5.0% |
| Fijians | 99.0 /100 | #39 | Exceptional 5.0% |