Guyanese vs Immigrants from Yemen Female Poverty
COMPARE
Guyanese
Immigrants from Yemen
Female Poverty
Female Poverty Comparison
Guyanese
Immigrants from Yemen
15.6%
FEMALE POVERTY
0.1/ 100
METRIC RATING
261st/ 347
METRIC RANK
22.8%
FEMALE POVERTY
0.0/ 100
METRIC RATING
342nd/ 347
METRIC RANK
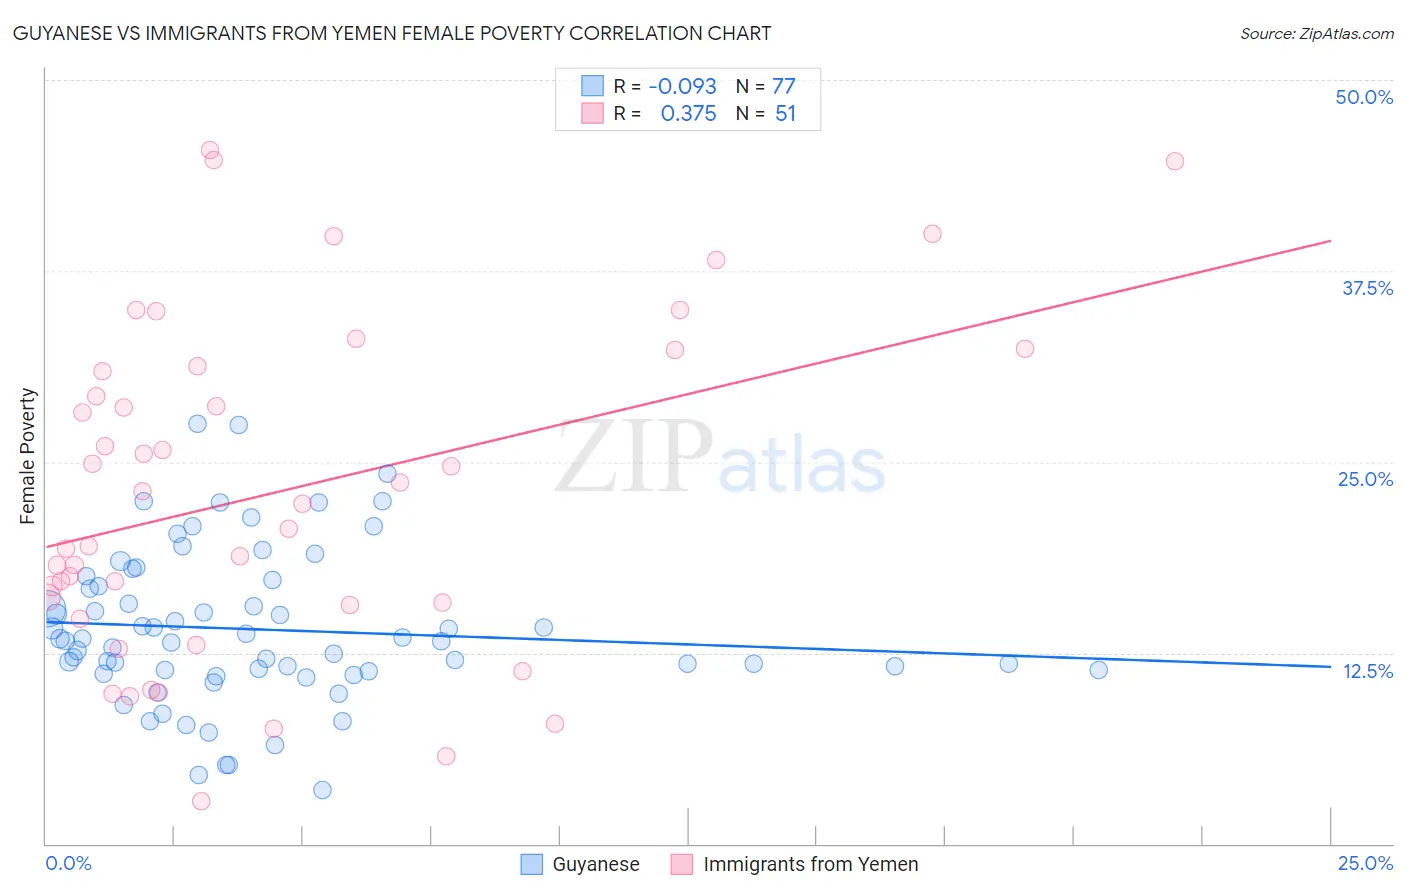
Guyanese vs Immigrants from Yemen Female Poverty Correlation Chart
The statistical analysis conducted on geographies consisting of 176,777,611 people shows a slight negative correlation between the proportion of Guyanese and poverty level among females in the United States with a correlation coefficient (R) of -0.093 and weighted average of 15.6%. Similarly, the statistical analysis conducted on geographies consisting of 82,433,611 people shows a mild positive correlation between the proportion of Immigrants from Yemen and poverty level among females in the United States with a correlation coefficient (R) of 0.375 and weighted average of 22.8%, a difference of 46.3%.
Female Poverty Correlation Summary
| Measurement | Guyanese | Immigrants from Yemen |
| Minimum | 3.5% | 2.8% |
| Maximum | 27.5% | 45.4% |
| Range | 24.0% | 42.6% |
| Mean | 14.0% | 23.0% |
| Median | 13.3% | 22.3% |
| Interquartile 25% (IQ1) | 11.3% | 15.6% |
| Interquartile 75% (IQ3) | 17.1% | 31.2% |
| Interquartile Range (IQR) | 5.7% | 15.6% |
| Standard Deviation (Sample) | 5.0% | 10.9% |
| Standard Deviation (Population) | 5.0% | 10.7% |
Similar Demographics by Female Poverty
Demographics Similar to Guyanese by Female Poverty
In terms of female poverty, the demographic groups most similar to Guyanese are Mexican American Indian (15.6%, a difference of 0.0%), Cherokee (15.6%, a difference of 0.010%), Immigrants from Guyana (15.6%, a difference of 0.10%), Immigrants from Ecuador (15.6%, a difference of 0.14%), and Cape Verdean (15.6%, a difference of 0.18%).
| Demographics | Rating | Rank | Female Poverty |
| Trinidadians and Tobagonians | 0.2 /100 | #254 | Tragic 15.4% |
| Ottawa | 0.2 /100 | #255 | Tragic 15.5% |
| Jamaicans | 0.2 /100 | #256 | Tragic 15.5% |
| Immigrants | Jamaica | 0.1 /100 | #257 | Tragic 15.6% |
| Shoshone | 0.1 /100 | #258 | Tragic 15.6% |
| Cape Verdeans | 0.1 /100 | #259 | Tragic 15.6% |
| Immigrants | Guyana | 0.1 /100 | #260 | Tragic 15.6% |
| Guyanese | 0.1 /100 | #261 | Tragic 15.6% |
| Mexican American Indians | 0.1 /100 | #262 | Tragic 15.6% |
| Cherokee | 0.1 /100 | #263 | Tragic 15.6% |
| Immigrants | Ecuador | 0.1 /100 | #264 | Tragic 15.6% |
| Immigrants | Liberia | 0.1 /100 | #265 | Tragic 15.7% |
| Immigrants | El Salvador | 0.1 /100 | #266 | Tragic 15.7% |
| Sub-Saharan Africans | 0.1 /100 | #267 | Tragic 15.8% |
| Immigrants | Nicaragua | 0.1 /100 | #268 | Tragic 15.8% |
Demographics Similar to Immigrants from Yemen by Female Poverty
In terms of female poverty, the demographic groups most similar to Immigrants from Yemen are Lumbee (23.5%, a difference of 3.0%), Crow (22.1%, a difference of 3.2%), Pima (23.6%, a difference of 3.3%), Navajo (23.9%, a difference of 4.6%), and Yup'ik (21.5%, a difference of 6.3%).
| Demographics | Rating | Rank | Female Poverty |
| Immigrants | Dominican Republic | 0.0 /100 | #333 | Tragic 19.3% |
| Houma | 0.0 /100 | #334 | Tragic 20.0% |
| Cheyenne | 0.0 /100 | #335 | Tragic 20.2% |
| Pueblo | 0.0 /100 | #336 | Tragic 20.7% |
| Yuman | 0.0 /100 | #337 | Tragic 20.8% |
| Sioux | 0.0 /100 | #338 | Tragic 20.9% |
| Hopi | 0.0 /100 | #339 | Tragic 21.0% |
| Yup'ik | 0.0 /100 | #340 | Tragic 21.5% |
| Crow | 0.0 /100 | #341 | Tragic 22.1% |
| Immigrants | Yemen | 0.0 /100 | #342 | Tragic 22.8% |
| Lumbee | 0.0 /100 | #343 | Tragic 23.5% |
| Pima | 0.0 /100 | #344 | Tragic 23.6% |
| Navajo | 0.0 /100 | #345 | Tragic 23.9% |
| Puerto Ricans | 0.0 /100 | #346 | Tragic 25.2% |
| Tohono O'odham | 0.0 /100 | #347 | Tragic 25.9% |