Guyanese vs Immigrants from Central America Female Poverty
COMPARE
Guyanese
Immigrants from Central America
Female Poverty
Female Poverty Comparison
Guyanese
Immigrants from Central America
15.6%
FEMALE POVERTY
0.1/ 100
METRIC RATING
261st/ 347
METRIC RANK
16.8%
FEMALE POVERTY
0.0/ 100
METRIC RATING
304th/ 347
METRIC RANK
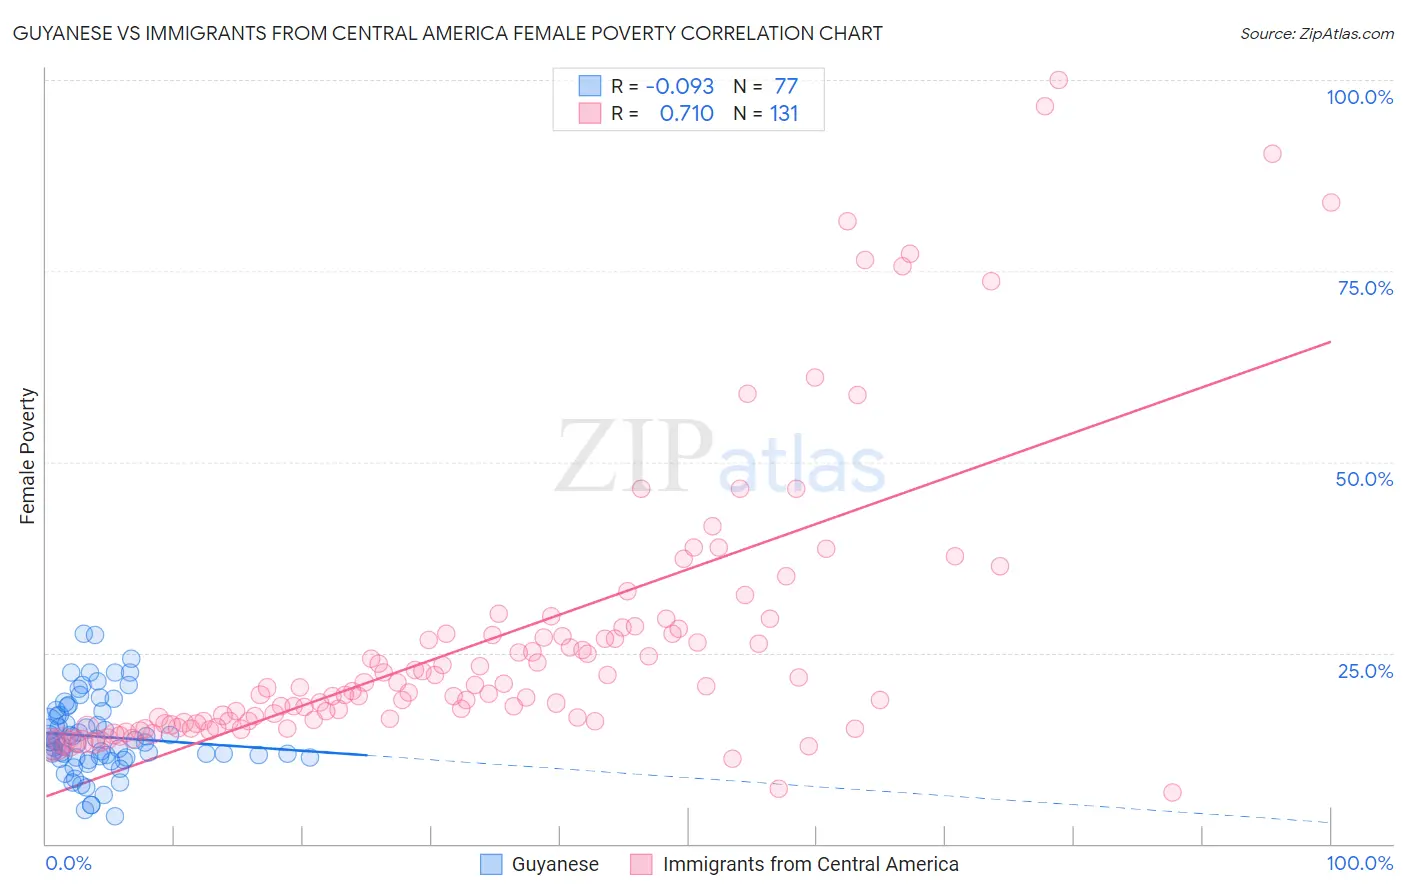
Guyanese vs Immigrants from Central America Female Poverty Correlation Chart
The statistical analysis conducted on geographies consisting of 176,777,611 people shows a slight negative correlation between the proportion of Guyanese and poverty level among females in the United States with a correlation coefficient (R) of -0.093 and weighted average of 15.6%. Similarly, the statistical analysis conducted on geographies consisting of 535,791,715 people shows a strong positive correlation between the proportion of Immigrants from Central America and poverty level among females in the United States with a correlation coefficient (R) of 0.710 and weighted average of 16.8%, a difference of 7.8%.
Female Poverty Correlation Summary
| Measurement | Guyanese | Immigrants from Central America |
| Minimum | 3.5% | 6.7% |
| Maximum | 27.5% | 100.0% |
| Range | 24.0% | 93.3% |
| Mean | 14.0% | 26.7% |
| Median | 13.3% | 20.4% |
| Interquartile 25% (IQ1) | 11.3% | 16.0% |
| Interquartile 75% (IQ3) | 17.1% | 27.6% |
| Interquartile Range (IQR) | 5.7% | 11.5% |
| Standard Deviation (Sample) | 5.0% | 18.5% |
| Standard Deviation (Population) | 5.0% | 18.4% |
Similar Demographics by Female Poverty
Demographics Similar to Guyanese by Female Poverty
In terms of female poverty, the demographic groups most similar to Guyanese are Mexican American Indian (15.6%, a difference of 0.0%), Cherokee (15.6%, a difference of 0.010%), Immigrants from Guyana (15.6%, a difference of 0.10%), Immigrants from Ecuador (15.6%, a difference of 0.14%), and Cape Verdean (15.6%, a difference of 0.18%).
| Demographics | Rating | Rank | Female Poverty |
| Trinidadians and Tobagonians | 0.2 /100 | #254 | Tragic 15.4% |
| Ottawa | 0.2 /100 | #255 | Tragic 15.5% |
| Jamaicans | 0.2 /100 | #256 | Tragic 15.5% |
| Immigrants | Jamaica | 0.1 /100 | #257 | Tragic 15.6% |
| Shoshone | 0.1 /100 | #258 | Tragic 15.6% |
| Cape Verdeans | 0.1 /100 | #259 | Tragic 15.6% |
| Immigrants | Guyana | 0.1 /100 | #260 | Tragic 15.6% |
| Guyanese | 0.1 /100 | #261 | Tragic 15.6% |
| Mexican American Indians | 0.1 /100 | #262 | Tragic 15.6% |
| Cherokee | 0.1 /100 | #263 | Tragic 15.6% |
| Immigrants | Ecuador | 0.1 /100 | #264 | Tragic 15.6% |
| Immigrants | Liberia | 0.1 /100 | #265 | Tragic 15.7% |
| Immigrants | El Salvador | 0.1 /100 | #266 | Tragic 15.7% |
| Sub-Saharan Africans | 0.1 /100 | #267 | Tragic 15.8% |
| Immigrants | Nicaragua | 0.1 /100 | #268 | Tragic 15.8% |
Demographics Similar to Immigrants from Central America by Female Poverty
In terms of female poverty, the demographic groups most similar to Immigrants from Central America are Immigrants from Grenada (16.8%, a difference of 0.0%), Choctaw (16.8%, a difference of 0.060%), Immigrants from Caribbean (16.9%, a difference of 0.27%), Seminole (16.9%, a difference of 0.40%), and African (16.9%, a difference of 0.46%).
| Demographics | Rating | Rank | Female Poverty |
| Mexicans | 0.0 /100 | #297 | Tragic 16.5% |
| Somalis | 0.0 /100 | #298 | Tragic 16.6% |
| Hispanics or Latinos | 0.0 /100 | #299 | Tragic 16.6% |
| Bahamians | 0.0 /100 | #300 | Tragic 16.6% |
| Guatemalans | 0.0 /100 | #301 | Tragic 16.7% |
| Chippewa | 0.0 /100 | #302 | Tragic 16.7% |
| Choctaw | 0.0 /100 | #303 | Tragic 16.8% |
| Immigrants | Central America | 0.0 /100 | #304 | Tragic 16.8% |
| Immigrants | Grenada | 0.0 /100 | #305 | Tragic 16.8% |
| Immigrants | Caribbean | 0.0 /100 | #306 | Tragic 16.9% |
| Seminole | 0.0 /100 | #307 | Tragic 16.9% |
| Africans | 0.0 /100 | #308 | Tragic 16.9% |
| Immigrants | Mexico | 0.0 /100 | #309 | Tragic 17.0% |
| Creek | 0.0 /100 | #310 | Tragic 17.0% |
| Immigrants | Guatemala | 0.0 /100 | #311 | Tragic 17.0% |