German vs Immigrants from Eastern Asia Married-Couple Family Poverty
COMPARE
German
Immigrants from Eastern Asia
Married-Couple Family Poverty
Married-Couple Family Poverty Comparison
Germans
Immigrants from Eastern Asia
4.0%
MARRIED-COUPLE FAMILY POVERTY
100.0/ 100
METRIC RATING
16th/ 347
METRIC RANK
4.8%
MARRIED-COUPLE FAMILY POVERTY
94.0/ 100
METRIC RATING
119th/ 347
METRIC RANK
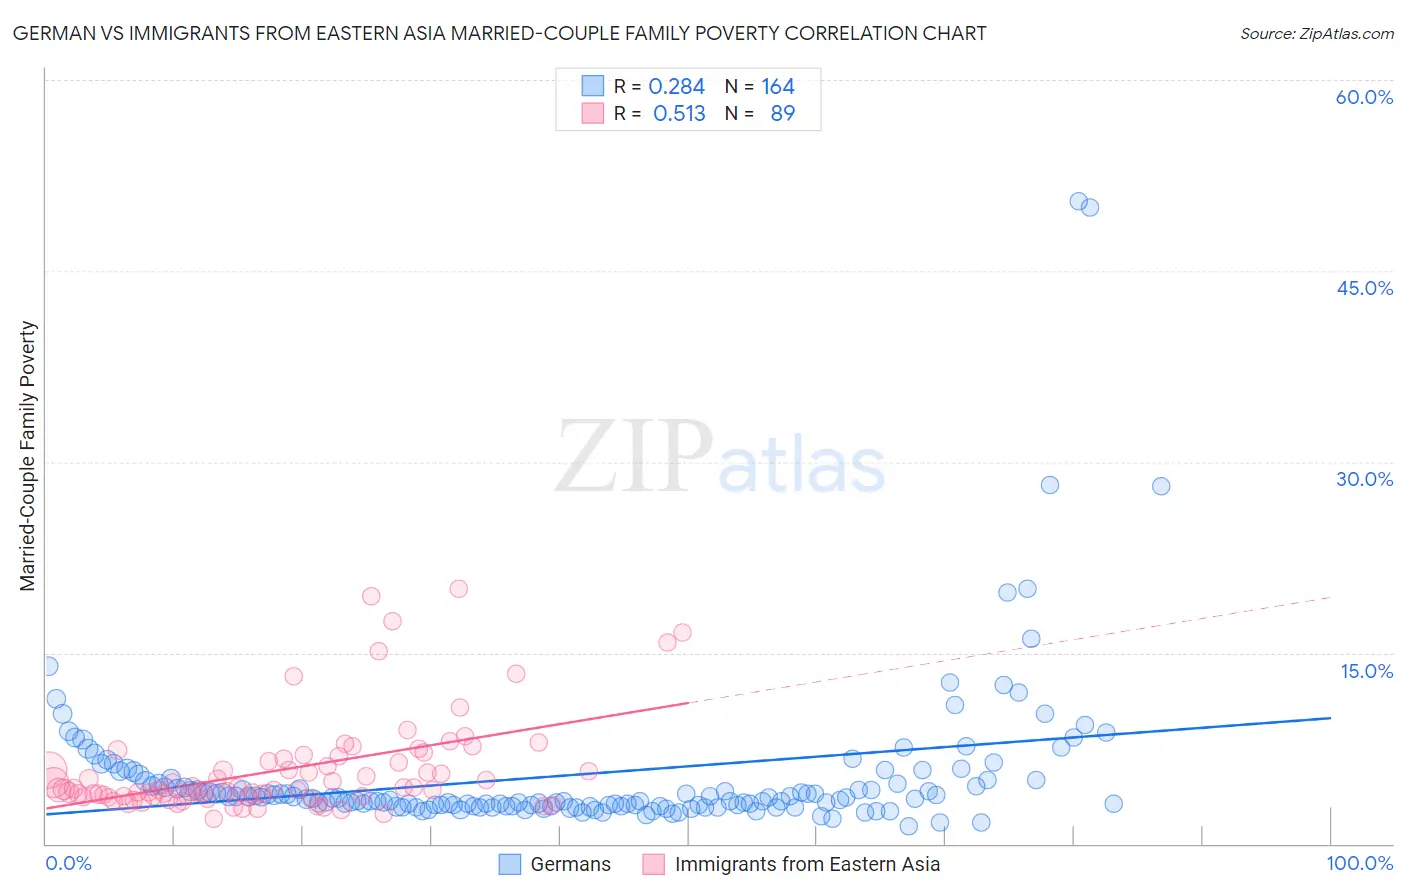
German vs Immigrants from Eastern Asia Married-Couple Family Poverty Correlation Chart
The statistical analysis conducted on geographies consisting of 564,067,138 people shows a weak positive correlation between the proportion of Germans and poverty level among married-couple families in the United States with a correlation coefficient (R) of 0.284 and weighted average of 4.0%. Similarly, the statistical analysis conducted on geographies consisting of 492,141,464 people shows a substantial positive correlation between the proportion of Immigrants from Eastern Asia and poverty level among married-couple families in the United States with a correlation coefficient (R) of 0.513 and weighted average of 4.8%, a difference of 19.0%.
Married-Couple Family Poverty Correlation Summary
| Measurement | German | Immigrants from Eastern Asia |
| Minimum | 1.4% | 1.9% |
| Maximum | 50.4% | 20.0% |
| Range | 49.1% | 18.1% |
| Mean | 5.4% | 5.8% |
| Median | 3.6% | 4.3% |
| Interquartile 25% (IQ1) | 3.0% | 3.7% |
| Interquartile 75% (IQ3) | 5.0% | 6.6% |
| Interquartile Range (IQR) | 2.0% | 2.9% |
| Standard Deviation (Sample) | 6.4% | 3.8% |
| Standard Deviation (Population) | 6.3% | 3.8% |
Similar Demographics by Married-Couple Family Poverty
Demographics Similar to Germans by Married-Couple Family Poverty
In terms of married-couple family poverty, the demographic groups most similar to Germans are Filipino (4.0%, a difference of 0.030%), Italian (4.0%, a difference of 0.040%), Polish (4.0%, a difference of 0.27%), Slovak (4.0%, a difference of 0.30%), and Czech (4.0%, a difference of 0.34%).
| Demographics | Rating | Rank | Married-Couple Family Poverty |
| Croatians | 100.0 /100 | #9 | Exceptional 3.9% |
| Carpatho Rusyns | 100.0 /100 | #10 | Exceptional 3.9% |
| Lithuanians | 100.0 /100 | #11 | Exceptional 4.0% |
| Bulgarians | 100.0 /100 | #12 | Exceptional 4.0% |
| Czechs | 100.0 /100 | #13 | Exceptional 4.0% |
| Slovaks | 100.0 /100 | #14 | Exceptional 4.0% |
| Poles | 100.0 /100 | #15 | Exceptional 4.0% |
| Germans | 100.0 /100 | #16 | Exceptional 4.0% |
| Filipinos | 100.0 /100 | #17 | Exceptional 4.0% |
| Italians | 100.0 /100 | #18 | Exceptional 4.0% |
| Immigrants | Ireland | 99.9 /100 | #19 | Exceptional 4.1% |
| Maltese | 99.9 /100 | #20 | Exceptional 4.1% |
| Zimbabweans | 99.9 /100 | #21 | Exceptional 4.1% |
| Immigrants | Singapore | 99.9 /100 | #22 | Exceptional 4.1% |
| Bhutanese | 99.9 /100 | #23 | Exceptional 4.1% |
Demographics Similar to Immigrants from Eastern Asia by Married-Couple Family Poverty
In terms of married-couple family poverty, the demographic groups most similar to Immigrants from Eastern Asia are Immigrants from Southern Europe (4.8%, a difference of 0.32%), Immigrants from Philippines (4.8%, a difference of 0.37%), Kenyan (4.8%, a difference of 0.39%), Indian (Asian) (4.8%, a difference of 0.42%), and White/Caucasian (4.8%, a difference of 0.46%).
| Demographics | Rating | Rank | Married-Couple Family Poverty |
| Tongans | 95.9 /100 | #112 | Exceptional 4.7% |
| Immigrants | Nepal | 95.9 /100 | #113 | Exceptional 4.7% |
| Immigrants | Indonesia | 95.1 /100 | #114 | Exceptional 4.8% |
| Taiwanese | 94.8 /100 | #115 | Exceptional 4.8% |
| Celtics | 94.8 /100 | #116 | Exceptional 4.8% |
| Kenyans | 94.7 /100 | #117 | Exceptional 4.8% |
| Immigrants | Philippines | 94.6 /100 | #118 | Exceptional 4.8% |
| Immigrants | Eastern Asia | 94.0 /100 | #119 | Exceptional 4.8% |
| Immigrants | Southern Europe | 93.4 /100 | #120 | Exceptional 4.8% |
| Indians (Asian) | 93.2 /100 | #121 | Exceptional 4.8% |
| Whites/Caucasians | 93.1 /100 | #122 | Exceptional 4.8% |
| Jordanians | 93.1 /100 | #123 | Exceptional 4.8% |
| Romanians | 92.5 /100 | #124 | Exceptional 4.8% |
| Immigrants | Bosnia and Herzegovina | 92.5 /100 | #125 | Exceptional 4.8% |
| Immigrants | Asia | 92.3 /100 | #126 | Exceptional 4.8% |