German vs Immigrants from Eastern Asia 7th Grade

COMPARE

German
Race
Ancestry
AfghanAfricanAlaska NativeAlaskan AthabascanAlbanianAleutAlsatianAmericanApacheArabArapahoArgentineanArmenianAssyrian/Chaldean/SyriacAustralianAustrianBahamianBangladeshiBarbadianBasqueBelgianBelizeanBermudanBhutaneseBlackfeetBolivianBrazilianBritishBritish West IndianBulgarianBurmeseCajunCambodianCanadianCape VerdeanCarpatho RusynCelticCentral AmericanCentral American IndianCherokeeCheyenneChickasawChileanChineseChippewaChoctawColombianColvilleComancheCosta RicanCreeCreekCroatianCrowCubanCypriotCzechCzechoslovakianDanishDelawareDominicanDutchDutch West IndianEastern EuropeanEcuadorianEgyptianEnglishEstonianEthiopianEuropeanFijianFilipinoFinnishFrenchFrench American IndianFrench CanadianGermanGerman RussianGhanaianGreekGuamanian/ChamorroGuatemalanGuyaneseHaitianHmongHonduranHopiHoumaHungarianIcelanderIndian (Asian)IndonesianInupiatIranianIraqiIrishIroquoisIsraeliItalianJamaicanJapaneseJordanianKenyanKiowaKoreanLaotianLatvianLebaneseLiberianLithuanianLumbeeLuxembourgerMacedonianMalaysianMalteseMarshalleseMenomineeMexicanMexican American IndianMongolianMoroccanNative HawaiianNavajoNepaleseNew ZealanderNicaraguanNigerianNorthern EuropeanNorwegianOkinawanOsageOttawaPaiutePakistaniPalestinianPanamanianParaguayanPennsylvania GermanPeruvianPimaPolishPortuguesePotawatomiPuebloPuerto RicanPuget Sound SalishRomanianRussianSalvadoranSamoanScandinavianScotch-IrishScottishSeminoleSenegaleseSerbianShoshoneSierra LeoneanSiouxSlavicSlovakSloveneSomaliSouth AfricanSouth AmericanSouth American IndianSoviet UnionSpaniardSpanishSpanish AmericanSpanish American IndianSri LankanSubsaharan AfricanSudaneseSwedishSwissSyrianTaiwaneseThaiTlingit-HaidaTohono O'OdhamTonganTrinidadian and TobagonianTsimshianTurkishU.S. Virgin IslanderUgandanUkrainianUruguayanUteVenezuelanVietnameseWelshWest IndianYakamaYaquiYugoslavianYumanYup'ikZimbabwean
Immigration
NonimmigrantsImmigrantsAfghanistanAfricaAlbaniaArgentinaArmeniaAsiaAustraliaAustriaBahamasBangladeshBarbadosBelarusBelgiumBelizeBoliviaBosnia and HerzegovinaBrazilBulgariaBurma/MyanmarCabo VerdeCambodiaCameroonCanadaCaribbeanCentral AmericaChileChinaColombiaCongoCosta RicaCroatiaCubaCzechoslovakiaDenmarkDominicaDominican RepublicEastern AfricaEastern EuropeEcuadorEgyptEl SalvadorEnglandEritreaEthiopiaEuropeFijiFranceGermanyGhanaGreeceGrenadaGuatemalaGuyanaHaitiHondurasHong KongHungaryIndiaIndonesiaIranIraqIrelandIsraelItalyJamaicaJapanJordanKazakhstanKenyaKoreaKuwaitLaosLatin AmericaLatviaLebanonLiberiaLithuaniaMalaysiaMexicoMicronesiaMiddle AfricaMoldovaMoroccoNepalNetherlandsNicaraguaNigeriaNorth AmericaNorth MacedoniaNorthern AfricaNorthern EuropeNorwayOceaniaPakistanPanamaPeruPhilippinesPolandPortugalRomaniaRussiaSaudi ArabiaScotlandSenegalSerbiaSierra LeoneSingaporeSomaliaSouth AfricaSouth AmericaSouth Central AsiaSouth Eastern AsiaSouthern EuropeSpainSri LankaSt. Vincent and the GrenadinesSudanSwedenSwitzerlandSyriaTaiwanThailandTrinidad and TobagoTurkeyUgandaUkraineUruguayUzbekistanVenezuelaVietnamWest IndiesWestern AfricaWestern AsiaWestern EuropeYemenZaireZimbabweAzores
Immigrants from Eastern Asia
Race
Ancestry
AfghanAfricanAlaska NativeAlaskan AthabascanAlbanianAleutAlsatianAmericanApacheArabArapahoArgentineanArmenianAssyrian/Chaldean/SyriacAustralianAustrianBahamianBangladeshiBarbadianBasqueBelgianBelizeanBermudanBhutaneseBlackfeetBolivianBrazilianBritishBritish West IndianBulgarianBurmeseCajunCambodianCanadianCape VerdeanCarpatho RusynCelticCentral AmericanCentral American IndianCherokeeCheyenneChickasawChileanChineseChippewaChoctawColombianColvilleComancheCosta RicanCreeCreekCroatianCrowCubanCypriotCzechCzechoslovakianDanishDelawareDominicanDutchDutch West IndianEastern EuropeanEcuadorianEgyptianEnglishEstonianEthiopianEuropeanFijianFilipinoFinnishFrenchFrench American IndianFrench CanadianGerman RussianGhanaianGreekGuamanian/ChamorroGuatemalanGuyaneseHaitianHmongHonduranHopiHoumaHungarianIcelanderIndian (Asian)IndonesianInupiatIranianIraqiIrishIroquoisIsraeliItalianJamaicanJapaneseJordanianKenyanKiowaKoreanLaotianLatvianLebaneseLiberianLithuanianLumbeeLuxembourgerMacedonianMalaysianMalteseMarshalleseMenomineeMexicanMexican American IndianMongolianMoroccanNative HawaiianNavajoNepaleseNew ZealanderNicaraguanNigerianNorthern EuropeanNorwegianOkinawanOsageOttawaPaiutePakistaniPalestinianPanamanianParaguayanPennsylvania GermanPeruvianPimaPolishPortuguesePotawatomiPuebloPuerto RicanPuget Sound SalishRomanianRussianSalvadoranSamoanScandinavianScotch-IrishScottishSeminoleSenegaleseSerbianShoshoneSierra LeoneanSiouxSlavicSlovakSloveneSomaliSouth AfricanSouth AmericanSouth American IndianSoviet UnionSpaniardSpanishSpanish AmericanSpanish American IndianSri LankanSubsaharan AfricanSudaneseSwedishSwissSyrianTaiwaneseThaiTlingit-HaidaTohono O'OdhamTonganTrinidadian and TobagonianTsimshianTurkishU.S. Virgin IslanderUgandanUkrainianUruguayanUteVenezuelanVietnameseWelshWest IndianYakamaYaquiYugoslavianYumanYup'ikZimbabwean
Immigration
NonimmigrantsImmigrantsAfghanistanAfricaAlbaniaArgentinaArmeniaAsiaAustraliaAustriaBahamasBangladeshBarbadosBelarusBelgiumBelizeBoliviaBosnia and HerzegovinaBrazilBulgariaBurma/MyanmarCabo VerdeCambodiaCameroonCanadaCaribbeanCentral AmericaChileChinaColombiaCongoCosta RicaCroatiaCubaCzechoslovakiaDenmarkDominicaDominican RepublicEastern AfricaEastern AsiaEastern EuropeEcuadorEgyptEl SalvadorEnglandEritreaEthiopiaEuropeFijiFranceGermanyGhanaGreeceGrenadaGuatemalaGuyanaHaitiHondurasHong KongHungaryIndiaIndonesiaIranIraqIrelandIsraelItalyJamaicaJapanJordanKazakhstanKenyaKoreaKuwaitLaosLatin AmericaLatviaLebanonLiberiaLithuaniaMalaysiaMexicoMicronesiaMiddle AfricaMoldovaMoroccoNepalNetherlandsNicaraguaNigeriaNorth AmericaNorth MacedoniaNorthern AfricaNorthern EuropeNorwayOceaniaPakistanPanamaPeruPhilippinesPolandPortugalRomaniaRussiaSaudi ArabiaScotlandSenegalSerbiaSierra LeoneSingaporeSomaliaSouth AfricaSouth AmericaSouth Central AsiaSouth Eastern AsiaSouthern EuropeSpainSri LankaSt. Vincent and the GrenadinesSudanSwedenSwitzerlandSyriaTaiwanThailandTrinidad and TobagoTurkeyUgandaUkraineUruguayUzbekistanVenezuelaVietnamWest IndiesWestern AfricaWestern AsiaWestern EuropeYemenZaireZimbabweAzores
7th Grade
Income
Poverty
Unemployment
Labor Participation
Family Structure
Vehicle Availability
Education Level
Disability

7th Grade Comparison

Germans

Immigrants from Eastern Asia

Exceptional
Tragic
97.7%
7TH GRADE
100.0/ 100
METRIC RATING
9th/ 347
METRIC RANK
95.6%
7TH GRADE
5.8/ 100
METRIC RATING
226th/ 347
METRIC RANK

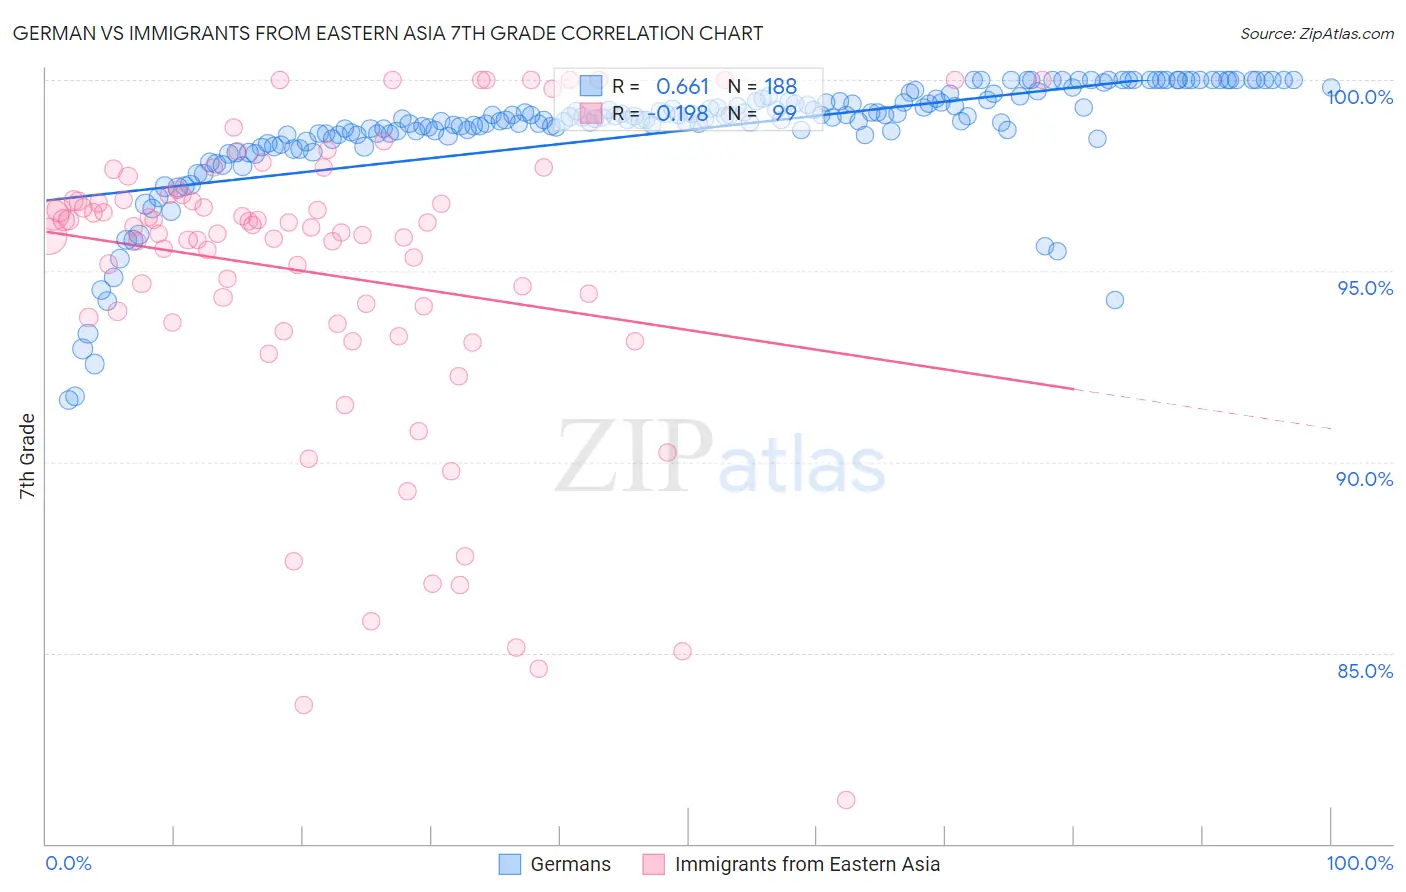
German vs Immigrants from Eastern Asia 7th Grade Correlation Chart

The statistical analysis conducted on geographies consisting of 548,360,249 people shows a significant positive correlation between the proportion of Germans and percentage of population with at least 7th grade education in the United States with a correlation coefficient (R) of 0.661 and weighted average of 97.7%. Similarly, the statistical analysis conducted on geographies consisting of 499,846,352 people shows a poor negative correlation between the proportion of Immigrants from Eastern Asia and percentage of population with at least 7th grade education in the United States with a correlation coefficient (R) of -0.198 and weighted average of 95.6%, a difference of 2.2%.
German vs Immigrants from Eastern Asia 7th Grade

7th Grade Correlation Summary

MeasurementGermanImmigrants from Eastern Asia
Minimum91.6%81.1%
Maximum100.0%100.0%
Range8.4%18.9%
Mean98.6%94.9%
Median99.0%96.0%
Interquartile 25% (IQ1)98.6%93.7%
Interquartile 75% (IQ3)99.5%96.9%
Interquartile Range (IQR)0.89%3.2%
Standard Deviation (Sample)1.5%4.0%
Standard Deviation (Population)1.5%4.0%

Similar Demographics by 7th Grade

Demographics Similar to Germans by 7th Grade

In terms of 7th grade, the demographic groups most similar to Germans are Slovak (97.8%, a difference of 0.020%), Norwegian (97.8%, a difference of 0.030%), Tsimshian (97.8%, a difference of 0.060%), Slovene (97.6%, a difference of 0.10%), and Alaskan Athabascan (97.6%, a difference of 0.11%).
DemographicsRating | Rank7th Grade
Finns
100.0
/100
|
#2
Exceptional
98.5%
Carpatho Rusyns
100.0
/100
|
#3
Exceptional
98.3%
Ottawa
100.0
/100
|
#4
Exceptional
98.1%
Dutch
100.0
/100
|
#5
Exceptional
97.9%
Tsimshian
100.0
/100
|
#6
Exceptional
97.8%
Norwegians
100.0
/100
|
#7
Exceptional
97.8%
Slovaks
100.0
/100
|
#8
Exceptional
97.8%
Germans
100.0
/100
|
#9
Exceptional
97.7%
Slovenes
100.0
/100
|
#10
Exceptional
97.6%
Alaskan Athabascans
100.0
/100
|
#11
Exceptional
97.6%
Poles
100.0
/100
|
#12
Exceptional
97.6%
Swedes
100.0
/100
|
#13
Exceptional
97.6%
Pennsylvania Germans
100.0
/100
|
#14
Exceptional
97.6%
English
100.0
/100
|
#15
Exceptional
97.6%
Irish
100.0
/100
|
#16
Exceptional
97.5%

Demographics Similar to Immigrants from Eastern Asia by 7th Grade

In terms of 7th grade, the demographic groups most similar to Immigrants from Eastern Asia are Immigrants from Malaysia (95.6%, a difference of 0.010%), Immigrants from Western Asia (95.6%, a difference of 0.010%), Immigrants from Syria (95.7%, a difference of 0.020%), Immigrants from Oceania (95.7%, a difference of 0.020%), and Immigrants from Eastern Africa (95.6%, a difference of 0.020%).
DemographicsRating | Rank7th Grade
Immigrants | Southern Europe
7.9
/100
|
#219
Tragic
95.7%
Sub-Saharan Africans
7.2
/100
|
#220
Tragic
95.7%
Samoans
7.0
/100
|
#221
Tragic
95.7%
Laotians
6.8
/100
|
#222
Tragic
95.7%
Immigrants | Syria
6.7
/100
|
#223
Tragic
95.7%
Immigrants | Oceania
6.7
/100
|
#224
Tragic
95.7%
Immigrants | Malaysia
6.2
/100
|
#225
Tragic
95.6%
Immigrants | Eastern Asia
5.8
/100
|
#226
Tragic
95.6%
Immigrants | Western Asia
5.4
/100
|
#227
Tragic
95.6%
Immigrants | Eastern Africa
5.1
/100
|
#228
Tragic
95.6%
Immigrants | Panama
4.9
/100
|
#229
Tragic
95.6%
Natives/Alaskans
4.2
/100
|
#230
Tragic
95.6%
Senegalese
4.0
/100
|
#231
Tragic
95.6%
Costa Ricans
3.3
/100
|
#232
Tragic
95.5%
Immigrants | Indonesia
3.3
/100
|
#233
Tragic
95.5%