French vs Pima Child Poverty Under the Age of 5
COMPARE
French
Pima
Child Poverty Under the Age of 5
Child Poverty Under the Age of 5 Comparison
French
Pima
17.5%
CHILD POVERTY UNDER THE AGE OF 5
33.6/ 100
METRIC RATING
189th/ 347
METRIC RANK
27.4%
CHILD POVERTY UNDER THE AGE OF 5
0.0/ 100
METRIC RATING
337th/ 347
METRIC RANK
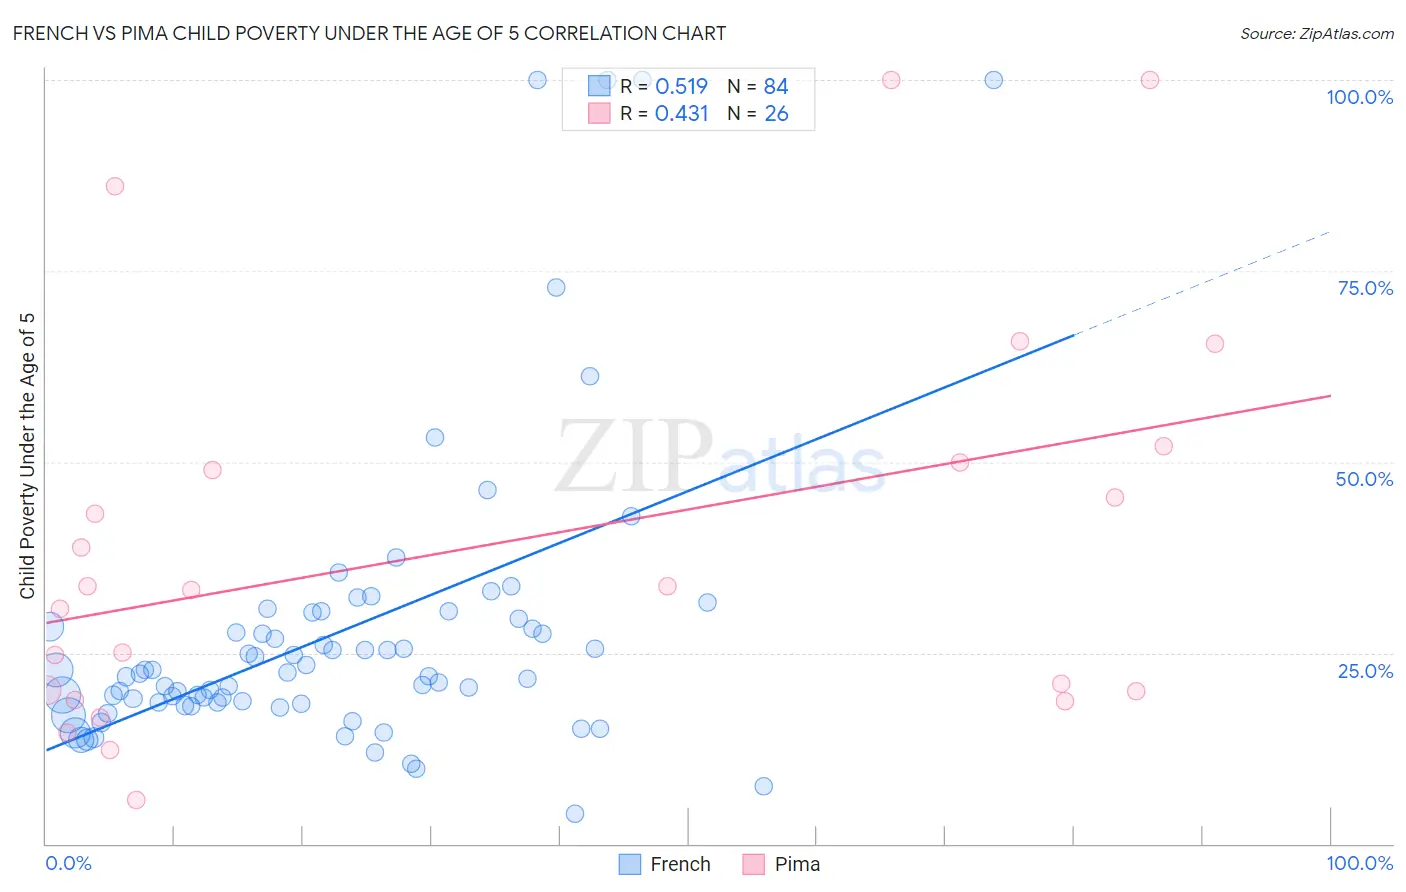
French vs Pima Child Poverty Under the Age of 5 Correlation Chart
The statistical analysis conducted on geographies consisting of 531,494,079 people shows a substantial positive correlation between the proportion of French and poverty level among children under the age of 5 in the United States with a correlation coefficient (R) of 0.519 and weighted average of 17.5%. Similarly, the statistical analysis conducted on geographies consisting of 61,270,853 people shows a moderate positive correlation between the proportion of Pima and poverty level among children under the age of 5 in the United States with a correlation coefficient (R) of 0.431 and weighted average of 27.4%, a difference of 56.4%.
Child Poverty Under the Age of 5 Correlation Summary
| Measurement | French | Pima |
| Minimum | 4.0% | 5.8% |
| Maximum | 100.0% | 100.0% |
| Range | 96.0% | 94.2% |
| Mean | 27.5% | 39.4% |
| Median | 22.1% | 33.4% |
| Interquartile 25% (IQ1) | 18.4% | 20.0% |
| Interquartile 75% (IQ3) | 28.9% | 50.0% |
| Interquartile Range (IQR) | 10.5% | 30.0% |
| Standard Deviation (Sample) | 19.4% | 26.0% |
| Standard Deviation (Population) | 19.3% | 25.5% |
Similar Demographics by Child Poverty Under the Age of 5
Demographics Similar to French by Child Poverty Under the Age of 5
In terms of child poverty under the age of 5, the demographic groups most similar to French are Carpatho Rusyn (17.5%, a difference of 0.010%), Kenyan (17.5%, a difference of 0.12%), Immigrants from Bosnia and Herzegovina (17.5%, a difference of 0.16%), Immigrants from Armenia (17.5%, a difference of 0.49%), and Slovak (17.6%, a difference of 0.52%).
| Demographics | Rating | Rank | Child Poverty Under the Age of 5 |
| Arabs | 40.7 /100 | #182 | Average 17.4% |
| Lebanese | 40.3 /100 | #183 | Average 17.4% |
| Immigrants | Costa Rica | 39.0 /100 | #184 | Fair 17.4% |
| Immigrants | Armenia | 38.0 /100 | #185 | Fair 17.5% |
| Immigrants | Bosnia and Herzegovina | 35.0 /100 | #186 | Fair 17.5% |
| Kenyans | 34.7 /100 | #187 | Fair 17.5% |
| Carpatho Rusyns | 33.6 /100 | #188 | Fair 17.5% |
| French | 33.6 /100 | #189 | Fair 17.5% |
| Slovaks | 29.2 /100 | #190 | Fair 17.6% |
| Immigrants | Afghanistan | 27.9 /100 | #191 | Fair 17.7% |
| Immigrants | Uruguay | 27.8 /100 | #192 | Fair 17.7% |
| Immigrants | Uganda | 25.0 /100 | #193 | Fair 17.7% |
| French Canadians | 24.6 /100 | #194 | Fair 17.7% |
| Sierra Leoneans | 24.1 /100 | #195 | Fair 17.7% |
| Immigrants | Portugal | 22.2 /100 | #196 | Fair 17.8% |
Demographics Similar to Pima by Child Poverty Under the Age of 5
In terms of child poverty under the age of 5, the demographic groups most similar to Pima are Hopi (27.7%, a difference of 1.0%), Yup'ik (27.7%, a difference of 1.1%), Sioux (26.9%, a difference of 1.9%), Cheyenne (28.3%, a difference of 3.3%), and Colville (25.7%, a difference of 6.8%).
| Demographics | Rating | Rank | Child Poverty Under the Age of 5 |
| Creek | 0.0 /100 | #330 | Tragic 24.2% |
| Kiowa | 0.0 /100 | #331 | Tragic 24.5% |
| Apache | 0.0 /100 | #332 | Tragic 25.0% |
| Natives/Alaskans | 0.0 /100 | #333 | Tragic 25.6% |
| Blacks/African Americans | 0.0 /100 | #334 | Tragic 25.7% |
| Colville | 0.0 /100 | #335 | Tragic 25.7% |
| Sioux | 0.0 /100 | #336 | Tragic 26.9% |
| Pima | 0.0 /100 | #337 | Tragic 27.4% |
| Hopi | 0.0 /100 | #338 | Tragic 27.7% |
| Yup'ik | 0.0 /100 | #339 | Tragic 27.7% |
| Cheyenne | 0.0 /100 | #340 | Tragic 28.3% |
| Immigrants | Yemen | 0.0 /100 | #341 | Tragic 29.3% |
| Tohono O'odham | 0.0 /100 | #342 | Tragic 29.5% |
| Yuman | 0.0 /100 | #343 | Tragic 29.5% |
| Crow | 0.0 /100 | #344 | Tragic 31.0% |