French vs Israeli Family Poverty
COMPARE
French
Israeli
Family Poverty
Family Poverty Comparison
French
Israelis
8.3%
FAMILY POVERTY
92.8/ 100
METRIC RATING
119th/ 347
METRIC RANK
8.9%
FAMILY POVERTY
62.1/ 100
METRIC RATING
168th/ 347
METRIC RANK
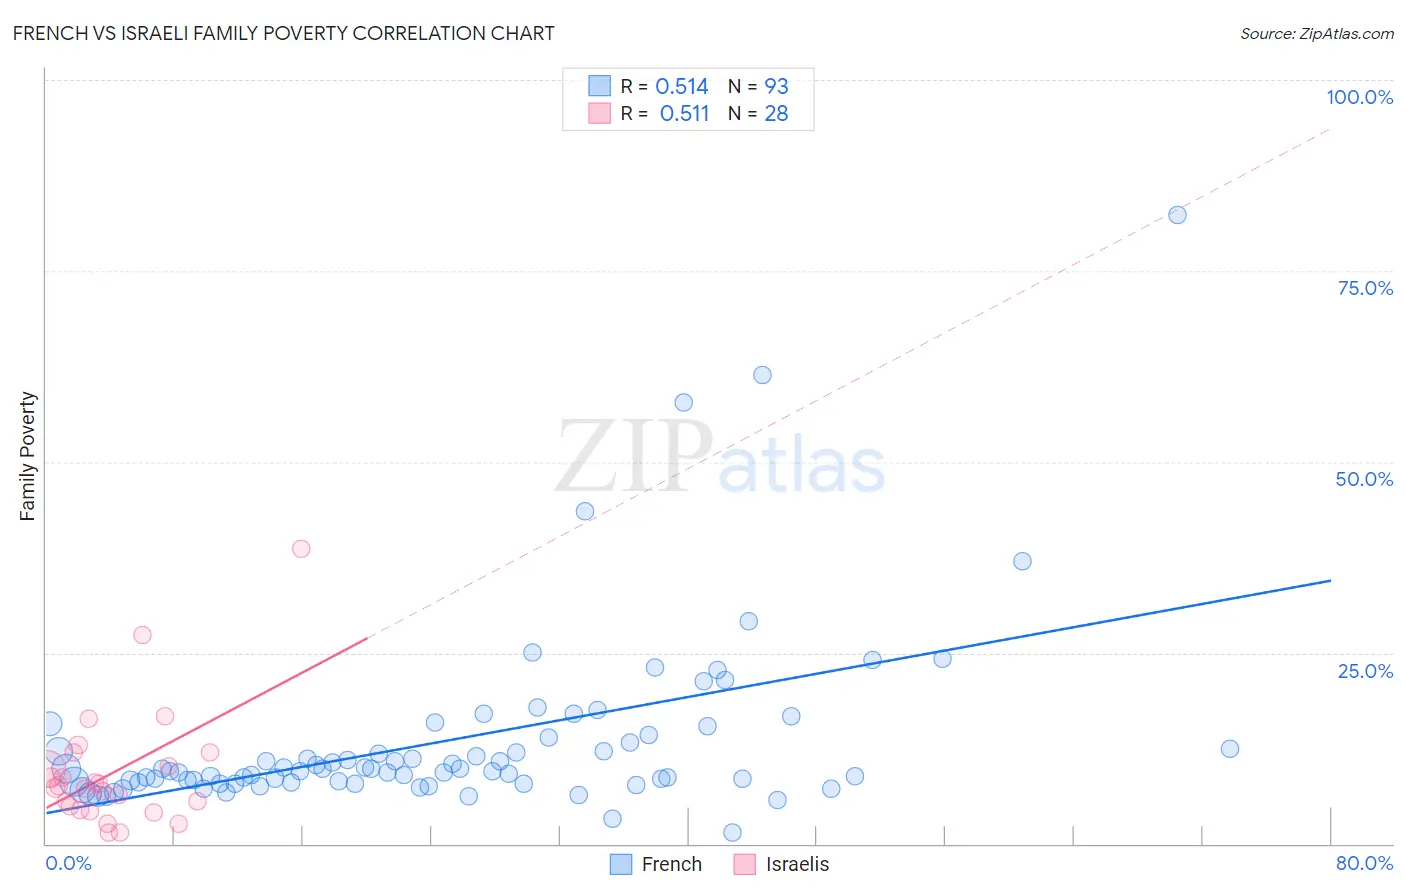
French vs Israeli Family Poverty Correlation Chart
The statistical analysis conducted on geographies consisting of 567,554,801 people shows a substantial positive correlation between the proportion of French and poverty level among families in the United States with a correlation coefficient (R) of 0.514 and weighted average of 8.3%. Similarly, the statistical analysis conducted on geographies consisting of 210,674,574 people shows a substantial positive correlation between the proportion of Israelis and poverty level among families in the United States with a correlation coefficient (R) of 0.511 and weighted average of 8.9%, a difference of 7.3%.
Family Poverty Correlation Summary
| Measurement | French | Israeli |
| Minimum | 1.5% | 1.4% |
| Maximum | 82.4% | 38.6% |
| Range | 80.9% | 37.2% |
| Mean | 13.4% | 9.3% |
| Median | 9.6% | 7.5% |
| Interquartile 25% (IQ1) | 8.0% | 4.6% |
| Interquartile 75% (IQ3) | 13.6% | 11.0% |
| Interquartile Range (IQR) | 5.6% | 6.4% |
| Standard Deviation (Sample) | 12.0% | 7.9% |
| Standard Deviation (Population) | 11.9% | 7.8% |
Similar Demographics by Family Poverty
Demographics Similar to French by Family Poverty
In terms of family poverty, the demographic groups most similar to French are Immigrants from Western Europe (8.2%, a difference of 0.070%), Immigrants from Russia (8.2%, a difference of 0.26%), South African (8.2%, a difference of 0.33%), Immigrants from Israel (8.2%, a difference of 0.39%), and Immigrants from Egypt (8.3%, a difference of 0.56%).
| Demographics | Rating | Rank | Family Poverty |
| Immigrants | France | 94.4 /100 | #112 | Exceptional 8.2% |
| Canadians | 94.2 /100 | #113 | Exceptional 8.2% |
| Immigrants | Zimbabwe | 94.0 /100 | #114 | Exceptional 8.2% |
| Immigrants | Israel | 93.5 /100 | #115 | Exceptional 8.2% |
| South Africans | 93.4 /100 | #116 | Exceptional 8.2% |
| Immigrants | Russia | 93.2 /100 | #117 | Exceptional 8.2% |
| Immigrants | Western Europe | 92.9 /100 | #118 | Exceptional 8.2% |
| French | 92.8 /100 | #119 | Exceptional 8.3% |
| Immigrants | Egypt | 91.6 /100 | #120 | Exceptional 8.3% |
| Native Hawaiians | 91.3 /100 | #121 | Exceptional 8.3% |
| Paraguayans | 91.2 /100 | #122 | Exceptional 8.3% |
| Palestinians | 91.1 /100 | #123 | Exceptional 8.3% |
| Soviet Union | 90.8 /100 | #124 | Exceptional 8.3% |
| Pakistanis | 90.8 /100 | #125 | Exceptional 8.3% |
| Icelanders | 90.3 /100 | #126 | Exceptional 8.3% |
Demographics Similar to Israelis by Family Poverty
In terms of family poverty, the demographic groups most similar to Israelis are Immigrants from Ethiopia (8.9%, a difference of 0.060%), Afghan (8.8%, a difference of 0.20%), Immigrants from Chile (8.9%, a difference of 0.35%), Guamanian/Chamorro (8.8%, a difference of 0.38%), and Celtic (8.8%, a difference of 0.41%).
| Demographics | Rating | Rank | Family Poverty |
| Immigrants | Northern Africa | 66.9 /100 | #161 | Good 8.8% |
| Ethiopians | 66.3 /100 | #162 | Good 8.8% |
| Pennsylvania Germans | 66.0 /100 | #163 | Good 8.8% |
| Celtics | 64.9 /100 | #164 | Good 8.8% |
| Guamanians/Chamorros | 64.7 /100 | #165 | Good 8.8% |
| Afghans | 63.5 /100 | #166 | Good 8.8% |
| Immigrants | Ethiopia | 62.5 /100 | #167 | Good 8.9% |
| Israelis | 62.1 /100 | #168 | Good 8.9% |
| Immigrants | Chile | 59.6 /100 | #169 | Average 8.9% |
| Kenyans | 58.2 /100 | #170 | Average 8.9% |
| Lebanese | 57.6 /100 | #171 | Average 8.9% |
| Immigrants | Peru | 57.5 /100 | #172 | Average 8.9% |
| Immigrants | Fiji | 56.4 /100 | #173 | Average 8.9% |
| Immigrants | Albania | 50.0 /100 | #174 | Average 9.0% |
| Costa Ricans | 49.3 /100 | #175 | Average 9.0% |