French vs Nonimmigrants Family Poverty
COMPARE
French
Nonimmigrants
Family Poverty
Family Poverty Comparison
French
Nonimmigrants
8.3%
FAMILY POVERTY
92.8/ 100
METRIC RATING
119th/ 347
METRIC RANK
9.8%
FAMILY POVERTY
6.7/ 100
METRIC RATING
215th/ 347
METRIC RANK
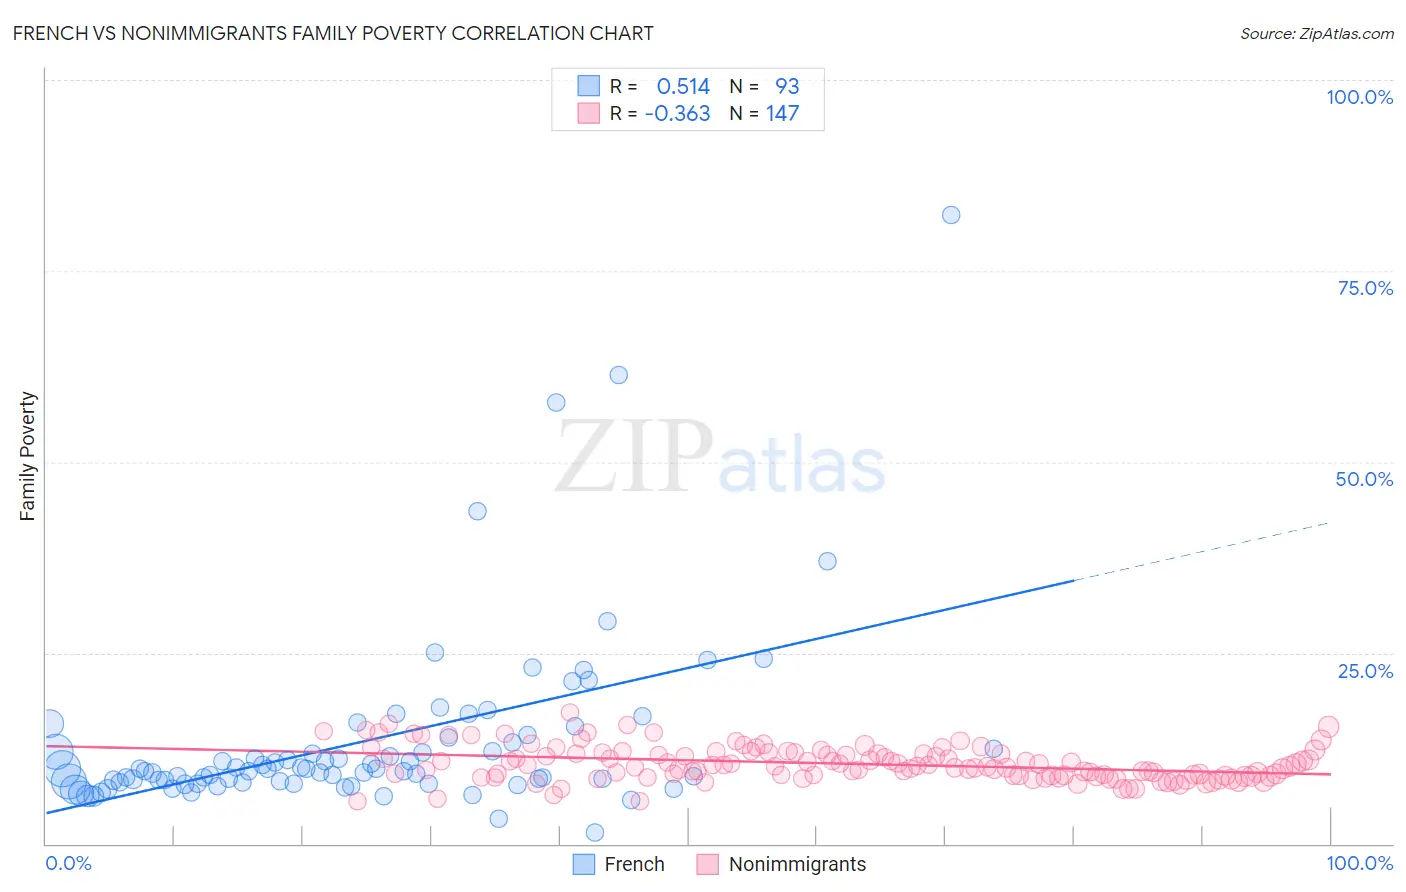
French vs Nonimmigrants Family Poverty Correlation Chart
The statistical analysis conducted on geographies consisting of 567,554,801 people shows a substantial positive correlation between the proportion of French and poverty level among families in the United States with a correlation coefficient (R) of 0.514 and weighted average of 8.3%. Similarly, the statistical analysis conducted on geographies consisting of 578,873,352 people shows a mild negative correlation between the proportion of Nonimmigrants and poverty level among families in the United States with a correlation coefficient (R) of -0.363 and weighted average of 9.8%, a difference of 18.5%.
Family Poverty Correlation Summary
| Measurement | French | Nonimmigrants |
| Minimum | 1.5% | 5.5% |
| Maximum | 82.4% | 17.3% |
| Range | 80.9% | 11.8% |
| Mean | 13.4% | 10.5% |
| Median | 9.6% | 10.2% |
| Interquartile 25% (IQ1) | 8.0% | 8.9% |
| Interquartile 75% (IQ3) | 13.6% | 11.8% |
| Interquartile Range (IQR) | 5.6% | 3.0% |
| Standard Deviation (Sample) | 12.0% | 2.2% |
| Standard Deviation (Population) | 11.9% | 2.2% |
Similar Demographics by Family Poverty
Demographics Similar to French by Family Poverty
In terms of family poverty, the demographic groups most similar to French are Immigrants from Western Europe (8.2%, a difference of 0.070%), Immigrants from Russia (8.2%, a difference of 0.26%), South African (8.2%, a difference of 0.33%), Immigrants from Israel (8.2%, a difference of 0.39%), and Immigrants from Egypt (8.3%, a difference of 0.56%).
| Demographics | Rating | Rank | Family Poverty |
| Immigrants | France | 94.4 /100 | #112 | Exceptional 8.2% |
| Canadians | 94.2 /100 | #113 | Exceptional 8.2% |
| Immigrants | Zimbabwe | 94.0 /100 | #114 | Exceptional 8.2% |
| Immigrants | Israel | 93.5 /100 | #115 | Exceptional 8.2% |
| South Africans | 93.4 /100 | #116 | Exceptional 8.2% |
| Immigrants | Russia | 93.2 /100 | #117 | Exceptional 8.2% |
| Immigrants | Western Europe | 92.9 /100 | #118 | Exceptional 8.2% |
| French | 92.8 /100 | #119 | Exceptional 8.3% |
| Immigrants | Egypt | 91.6 /100 | #120 | Exceptional 8.3% |
| Native Hawaiians | 91.3 /100 | #121 | Exceptional 8.3% |
| Paraguayans | 91.2 /100 | #122 | Exceptional 8.3% |
| Palestinians | 91.1 /100 | #123 | Exceptional 8.3% |
| Soviet Union | 90.8 /100 | #124 | Exceptional 8.3% |
| Pakistanis | 90.8 /100 | #125 | Exceptional 8.3% |
| Icelanders | 90.3 /100 | #126 | Exceptional 8.3% |
Demographics Similar to Nonimmigrants by Family Poverty
In terms of family poverty, the demographic groups most similar to Nonimmigrants are Immigrants from Micronesia (9.8%, a difference of 0.030%), Moroccan (9.8%, a difference of 0.060%), American (9.8%, a difference of 0.26%), Panamanian (9.8%, a difference of 0.58%), and Osage (9.7%, a difference of 0.61%).
| Demographics | Rating | Rank | Family Poverty |
| Immigrants | Eastern Africa | 15.1 /100 | #208 | Poor 9.5% |
| Immigrants | Uruguay | 14.0 /100 | #209 | Poor 9.5% |
| Alsatians | 11.3 /100 | #210 | Poor 9.6% |
| Malaysians | 10.6 /100 | #211 | Poor 9.6% |
| Immigrants | Thailand | 9.7 /100 | #212 | Tragic 9.7% |
| Osage | 8.0 /100 | #213 | Tragic 9.7% |
| Immigrants | Micronesia | 6.7 /100 | #214 | Tragic 9.8% |
| Immigrants | Nonimmigrants | 6.7 /100 | #215 | Tragic 9.8% |
| Moroccans | 6.5 /100 | #216 | Tragic 9.8% |
| Americans | 6.2 /100 | #217 | Tragic 9.8% |
| Panamanians | 5.6 /100 | #218 | Tragic 9.8% |
| Immigrants | Eritrea | 5.4 /100 | #219 | Tragic 9.9% |
| Bermudans | 5.3 /100 | #220 | Tragic 9.9% |
| Immigrants | Cambodia | 4.8 /100 | #221 | Tragic 9.9% |
| Japanese | 4.8 /100 | #222 | Tragic 9.9% |