French vs Immigrants from Latvia Single Father Poverty
COMPARE
French
Immigrants from Latvia
Single Father Poverty
Single Father Poverty Comparison
French
Immigrants from Latvia
18.2%
SINGLE FATHER POVERTY
0.0/ 100
METRIC RATING
297th/ 347
METRIC RANK
15.8%
SINGLE FATHER POVERTY
94.7/ 100
METRIC RATING
112th/ 347
METRIC RANK
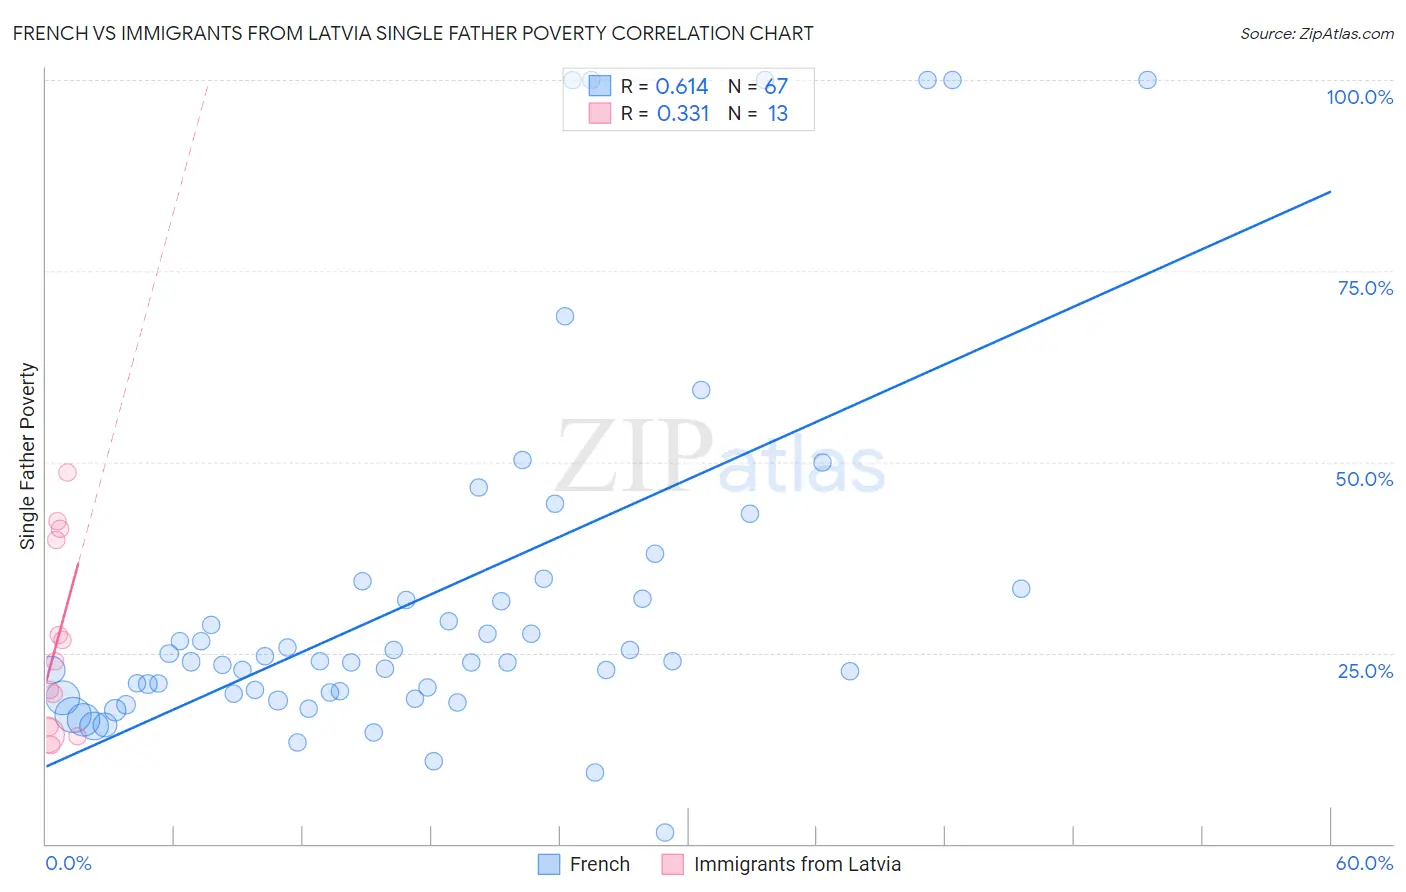
French vs Immigrants from Latvia Single Father Poverty Correlation Chart
The statistical analysis conducted on geographies consisting of 409,472,161 people shows a significant positive correlation between the proportion of French and poverty level among single fathers in the United States with a correlation coefficient (R) of 0.614 and weighted average of 18.2%. Similarly, the statistical analysis conducted on geographies consisting of 98,106,099 people shows a mild positive correlation between the proportion of Immigrants from Latvia and poverty level among single fathers in the United States with a correlation coefficient (R) of 0.331 and weighted average of 15.8%, a difference of 15.2%.
Single Father Poverty Correlation Summary
| Measurement | French | Immigrants from Latvia |
| Minimum | 1.4% | 12.9% |
| Maximum | 100.0% | 48.6% |
| Range | 98.6% | 35.7% |
| Mean | 32.5% | 26.6% |
| Median | 23.8% | 23.9% |
| Interquartile 25% (IQ1) | 19.7% | 14.7% |
| Interquartile 75% (IQ3) | 33.3% | 40.4% |
| Interquartile Range (IQR) | 13.7% | 25.7% |
| Standard Deviation (Sample) | 24.1% | 12.4% |
| Standard Deviation (Population) | 23.9% | 11.9% |
Similar Demographics by Single Father Poverty
Demographics Similar to French by Single Father Poverty
In terms of single father poverty, the demographic groups most similar to French are Seminole (18.1%, a difference of 0.21%), Yakama (18.1%, a difference of 0.31%), U.S. Virgin Islander (18.1%, a difference of 0.37%), Alaska Native (18.1%, a difference of 0.40%), and Immigrants from Bahamas (18.1%, a difference of 0.51%).
| Demographics | Rating | Rank | Single Father Poverty |
| West Indians | 0.0 /100 | #290 | Tragic 18.0% |
| Alaskan Athabascans | 0.0 /100 | #291 | Tragic 18.1% |
| Immigrants | Bahamas | 0.0 /100 | #292 | Tragic 18.1% |
| Alaska Natives | 0.0 /100 | #293 | Tragic 18.1% |
| U.S. Virgin Islanders | 0.0 /100 | #294 | Tragic 18.1% |
| Yakama | 0.0 /100 | #295 | Tragic 18.1% |
| Seminole | 0.0 /100 | #296 | Tragic 18.1% |
| French | 0.0 /100 | #297 | Tragic 18.2% |
| Africans | 0.0 /100 | #298 | Tragic 18.3% |
| Whites/Caucasians | 0.0 /100 | #299 | Tragic 18.4% |
| Immigrants | Dominican Republic | 0.0 /100 | #300 | Tragic 18.4% |
| Hungarians | 0.0 /100 | #301 | Tragic 18.5% |
| Comanche | 0.0 /100 | #302 | Tragic 18.5% |
| Celtics | 0.0 /100 | #303 | Tragic 18.5% |
| Ute | 0.0 /100 | #304 | Tragic 18.5% |
Demographics Similar to Immigrants from Latvia by Single Father Poverty
In terms of single father poverty, the demographic groups most similar to Immigrants from Latvia are Bulgarian (15.8%, a difference of 0.030%), Danish (15.8%, a difference of 0.040%), Argentinean (15.8%, a difference of 0.060%), Immigrants from Africa (15.8%, a difference of 0.080%), and Turkish (15.8%, a difference of 0.090%).
| Demographics | Rating | Rank | Single Father Poverty |
| Immigrants | Australia | 96.1 /100 | #105 | Exceptional 15.7% |
| Immigrants | Poland | 95.8 /100 | #106 | Exceptional 15.7% |
| Native Hawaiians | 95.8 /100 | #107 | Exceptional 15.7% |
| Pakistanis | 95.7 /100 | #108 | Exceptional 15.7% |
| Turks | 95.1 /100 | #109 | Exceptional 15.8% |
| Immigrants | Africa | 95.1 /100 | #110 | Exceptional 15.8% |
| Bulgarians | 94.8 /100 | #111 | Exceptional 15.8% |
| Immigrants | Latvia | 94.7 /100 | #112 | Exceptional 15.8% |
| Danes | 94.5 /100 | #113 | Exceptional 15.8% |
| Argentineans | 94.4 /100 | #114 | Exceptional 15.8% |
| Immigrants | Thailand | 93.6 /100 | #115 | Exceptional 15.8% |
| Immigrants | Argentina | 92.8 /100 | #116 | Exceptional 15.8% |
| Immigrants | Colombia | 92.6 /100 | #117 | Exceptional 15.8% |
| Immigrants | Eastern Europe | 92.5 /100 | #118 | Exceptional 15.8% |
| Immigrants | Belarus | 92.4 /100 | #119 | Exceptional 15.8% |