French vs Immigrants from Saudi Arabia Single Father Poverty
COMPARE
French
Immigrants from Saudi Arabia
Single Father Poverty
Single Father Poverty Comparison
French
Immigrants from Saudi Arabia
18.2%
SINGLE FATHER POVERTY
0.0/ 100
METRIC RATING
297th/ 347
METRIC RANK
16.9%
SINGLE FATHER POVERTY
2.7/ 100
METRIC RATING
238th/ 347
METRIC RANK
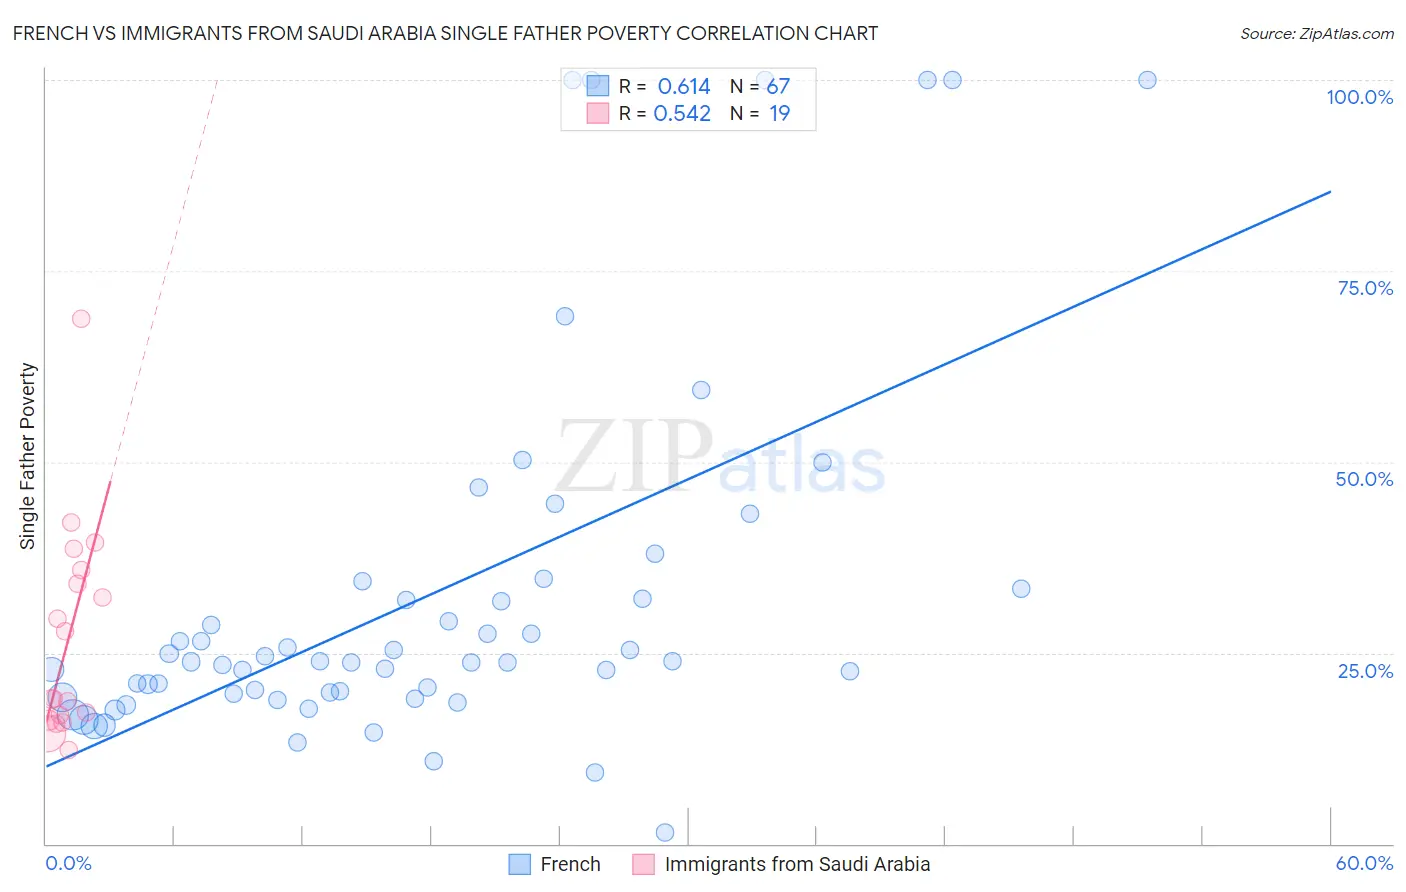
French vs Immigrants from Saudi Arabia Single Father Poverty Correlation Chart
The statistical analysis conducted on geographies consisting of 409,472,161 people shows a significant positive correlation between the proportion of French and poverty level among single fathers in the United States with a correlation coefficient (R) of 0.614 and weighted average of 18.2%. Similarly, the statistical analysis conducted on geographies consisting of 144,012,732 people shows a substantial positive correlation between the proportion of Immigrants from Saudi Arabia and poverty level among single fathers in the United States with a correlation coefficient (R) of 0.542 and weighted average of 16.9%, a difference of 7.3%.
Single Father Poverty Correlation Summary
| Measurement | French | Immigrants from Saudi Arabia |
| Minimum | 1.4% | 12.3% |
| Maximum | 100.0% | 68.8% |
| Range | 98.6% | 56.4% |
| Mean | 32.5% | 27.0% |
| Median | 23.8% | 19.0% |
| Interquartile 25% (IQ1) | 19.7% | 16.2% |
| Interquartile 75% (IQ3) | 33.3% | 35.9% |
| Interquartile Range (IQR) | 13.7% | 19.7% |
| Standard Deviation (Sample) | 24.1% | 14.1% |
| Standard Deviation (Population) | 23.9% | 13.7% |
Similar Demographics by Single Father Poverty
Demographics Similar to French by Single Father Poverty
In terms of single father poverty, the demographic groups most similar to French are Seminole (18.1%, a difference of 0.21%), Yakama (18.1%, a difference of 0.31%), U.S. Virgin Islander (18.1%, a difference of 0.37%), Alaska Native (18.1%, a difference of 0.40%), and Immigrants from Bahamas (18.1%, a difference of 0.51%).
| Demographics | Rating | Rank | Single Father Poverty |
| West Indians | 0.0 /100 | #290 | Tragic 18.0% |
| Alaskan Athabascans | 0.0 /100 | #291 | Tragic 18.1% |
| Immigrants | Bahamas | 0.0 /100 | #292 | Tragic 18.1% |
| Alaska Natives | 0.0 /100 | #293 | Tragic 18.1% |
| U.S. Virgin Islanders | 0.0 /100 | #294 | Tragic 18.1% |
| Yakama | 0.0 /100 | #295 | Tragic 18.1% |
| Seminole | 0.0 /100 | #296 | Tragic 18.1% |
| French | 0.0 /100 | #297 | Tragic 18.2% |
| Africans | 0.0 /100 | #298 | Tragic 18.3% |
| Whites/Caucasians | 0.0 /100 | #299 | Tragic 18.4% |
| Immigrants | Dominican Republic | 0.0 /100 | #300 | Tragic 18.4% |
| Hungarians | 0.0 /100 | #301 | Tragic 18.5% |
| Comanche | 0.0 /100 | #302 | Tragic 18.5% |
| Celtics | 0.0 /100 | #303 | Tragic 18.5% |
| Ute | 0.0 /100 | #304 | Tragic 18.5% |
Demographics Similar to Immigrants from Saudi Arabia by Single Father Poverty
In terms of single father poverty, the demographic groups most similar to Immigrants from Saudi Arabia are Bermudan (16.9%, a difference of 0.020%), Finnish (16.9%, a difference of 0.030%), Immigrants from Western Europe (16.9%, a difference of 0.070%), Immigrants from Germany (16.9%, a difference of 0.070%), and Subsaharan African (16.9%, a difference of 0.070%).
| Demographics | Rating | Rank | Single Father Poverty |
| Spanish Americans | 3.7 /100 | #231 | Tragic 16.9% |
| Immigrants | Grenada | 3.7 /100 | #232 | Tragic 16.9% |
| Senegalese | 3.2 /100 | #233 | Tragic 16.9% |
| Marshallese | 3.1 /100 | #234 | Tragic 16.9% |
| Immigrants | Western Europe | 2.9 /100 | #235 | Tragic 16.9% |
| Immigrants | Germany | 2.9 /100 | #236 | Tragic 16.9% |
| Sub-Saharan Africans | 2.9 /100 | #237 | Tragic 16.9% |
| Immigrants | Saudi Arabia | 2.7 /100 | #238 | Tragic 16.9% |
| Bermudans | 2.6 /100 | #239 | Tragic 16.9% |
| Finns | 2.6 /100 | #240 | Tragic 16.9% |
| Czechs | 2.3 /100 | #241 | Tragic 17.0% |
| Moroccans | 2.1 /100 | #242 | Tragic 17.0% |
| Immigrants | Cabo Verde | 1.6 /100 | #243 | Tragic 17.0% |
| Hondurans | 1.6 /100 | #244 | Tragic 17.0% |
| Trinidadians and Tobagonians | 1.5 /100 | #245 | Tragic 17.0% |