Canadian vs Immigrants from Latvia Single Father Poverty
COMPARE
Canadian
Immigrants from Latvia
Single Father Poverty
Single Father Poverty Comparison
Canadians
Immigrants from Latvia
17.1%
SINGLE FATHER POVERTY
1.3/ 100
METRIC RATING
249th/ 347
METRIC RANK
15.8%
SINGLE FATHER POVERTY
94.7/ 100
METRIC RATING
112th/ 347
METRIC RANK
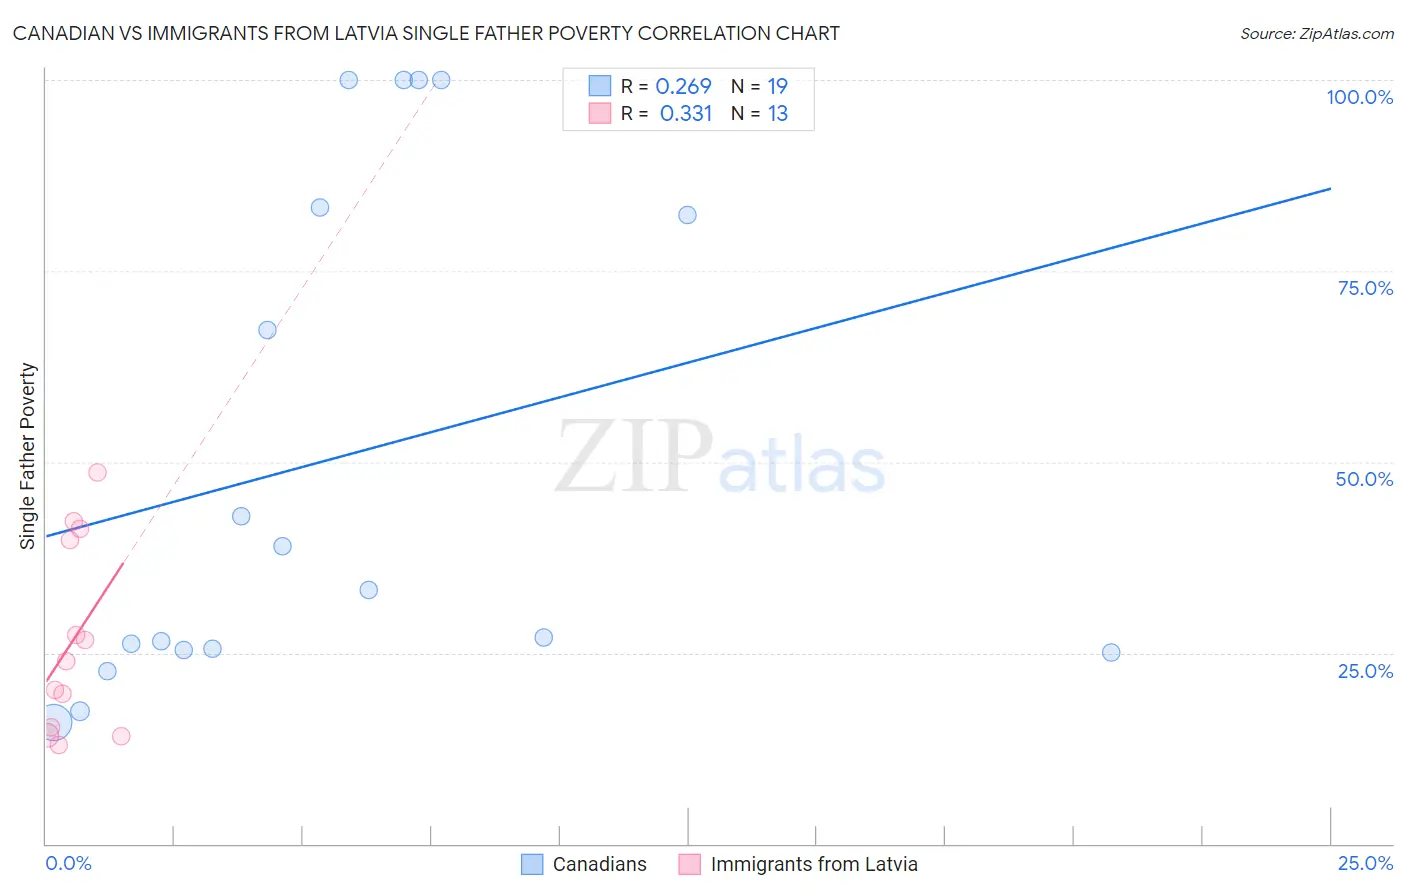
Canadian vs Immigrants from Latvia Single Father Poverty Correlation Chart
The statistical analysis conducted on geographies consisting of 333,608,234 people shows a weak positive correlation between the proportion of Canadians and poverty level among single fathers in the United States with a correlation coefficient (R) of 0.269 and weighted average of 17.1%. Similarly, the statistical analysis conducted on geographies consisting of 98,106,099 people shows a mild positive correlation between the proportion of Immigrants from Latvia and poverty level among single fathers in the United States with a correlation coefficient (R) of 0.331 and weighted average of 15.8%, a difference of 8.3%.
Single Father Poverty Correlation Summary
| Measurement | Canadian | Immigrants from Latvia |
| Minimum | 15.9% | 12.9% |
| Maximum | 100.0% | 48.6% |
| Range | 84.1% | 35.7% |
| Mean | 50.5% | 26.6% |
| Median | 33.2% | 23.9% |
| Interquartile 25% (IQ1) | 25.4% | 14.7% |
| Interquartile 75% (IQ3) | 83.3% | 40.4% |
| Interquartile Range (IQR) | 57.9% | 25.7% |
| Standard Deviation (Sample) | 32.8% | 12.4% |
| Standard Deviation (Population) | 31.9% | 11.9% |
Similar Demographics by Single Father Poverty
Demographics Similar to Canadians by Single Father Poverty
In terms of single father poverty, the demographic groups most similar to Canadians are Czechoslovakian (17.1%, a difference of 0.040%), Greek (17.1%, a difference of 0.050%), Austrian (17.1%, a difference of 0.13%), Luxembourger (17.1%, a difference of 0.14%), and Immigrants from Ireland (17.1%, a difference of 0.15%).
| Demographics | Rating | Rank | Single Father Poverty |
| Moroccans | 2.1 /100 | #242 | Tragic 17.0% |
| Immigrants | Cabo Verde | 1.6 /100 | #243 | Tragic 17.0% |
| Hondurans | 1.6 /100 | #244 | Tragic 17.0% |
| Trinidadians and Tobagonians | 1.5 /100 | #245 | Tragic 17.0% |
| Immigrants | Ireland | 1.4 /100 | #246 | Tragic 17.1% |
| Greeks | 1.3 /100 | #247 | Tragic 17.1% |
| Czechoslovakians | 1.3 /100 | #248 | Tragic 17.1% |
| Canadians | 1.3 /100 | #249 | Tragic 17.1% |
| Austrians | 1.1 /100 | #250 | Tragic 17.1% |
| Luxembourgers | 1.1 /100 | #251 | Tragic 17.1% |
| Croatians | 1.0 /100 | #252 | Tragic 17.1% |
| Cree | 1.0 /100 | #253 | Tragic 17.1% |
| Immigrants | Honduras | 0.9 /100 | #254 | Tragic 17.1% |
| Sierra Leoneans | 0.8 /100 | #255 | Tragic 17.2% |
| Immigrants | Haiti | 0.8 /100 | #256 | Tragic 17.2% |
Demographics Similar to Immigrants from Latvia by Single Father Poverty
In terms of single father poverty, the demographic groups most similar to Immigrants from Latvia are Bulgarian (15.8%, a difference of 0.030%), Danish (15.8%, a difference of 0.040%), Argentinean (15.8%, a difference of 0.060%), Immigrants from Africa (15.8%, a difference of 0.080%), and Turkish (15.8%, a difference of 0.090%).
| Demographics | Rating | Rank | Single Father Poverty |
| Immigrants | Australia | 96.1 /100 | #105 | Exceptional 15.7% |
| Immigrants | Poland | 95.8 /100 | #106 | Exceptional 15.7% |
| Native Hawaiians | 95.8 /100 | #107 | Exceptional 15.7% |
| Pakistanis | 95.7 /100 | #108 | Exceptional 15.7% |
| Turks | 95.1 /100 | #109 | Exceptional 15.8% |
| Immigrants | Africa | 95.1 /100 | #110 | Exceptional 15.8% |
| Bulgarians | 94.8 /100 | #111 | Exceptional 15.8% |
| Immigrants | Latvia | 94.7 /100 | #112 | Exceptional 15.8% |
| Danes | 94.5 /100 | #113 | Exceptional 15.8% |
| Argentineans | 94.4 /100 | #114 | Exceptional 15.8% |
| Immigrants | Thailand | 93.6 /100 | #115 | Exceptional 15.8% |
| Immigrants | Argentina | 92.8 /100 | #116 | Exceptional 15.8% |
| Immigrants | Colombia | 92.6 /100 | #117 | Exceptional 15.8% |
| Immigrants | Eastern Europe | 92.5 /100 | #118 | Exceptional 15.8% |
| Immigrants | Belarus | 92.4 /100 | #119 | Exceptional 15.8% |