French vs Immigrants from Latvia College, 1 year or more
COMPARE
French
Immigrants from Latvia
College, 1 year or more
College, 1 year or more Comparison
French
Immigrants from Latvia
58.9%
COLLEGE, 1 YEAR OR MORE
34.4/ 100
METRIC RATING
188th/ 347
METRIC RANK
64.8%
COLLEGE, 1 YEAR OR MORE
99.9/ 100
METRIC RATING
42nd/ 347
METRIC RANK
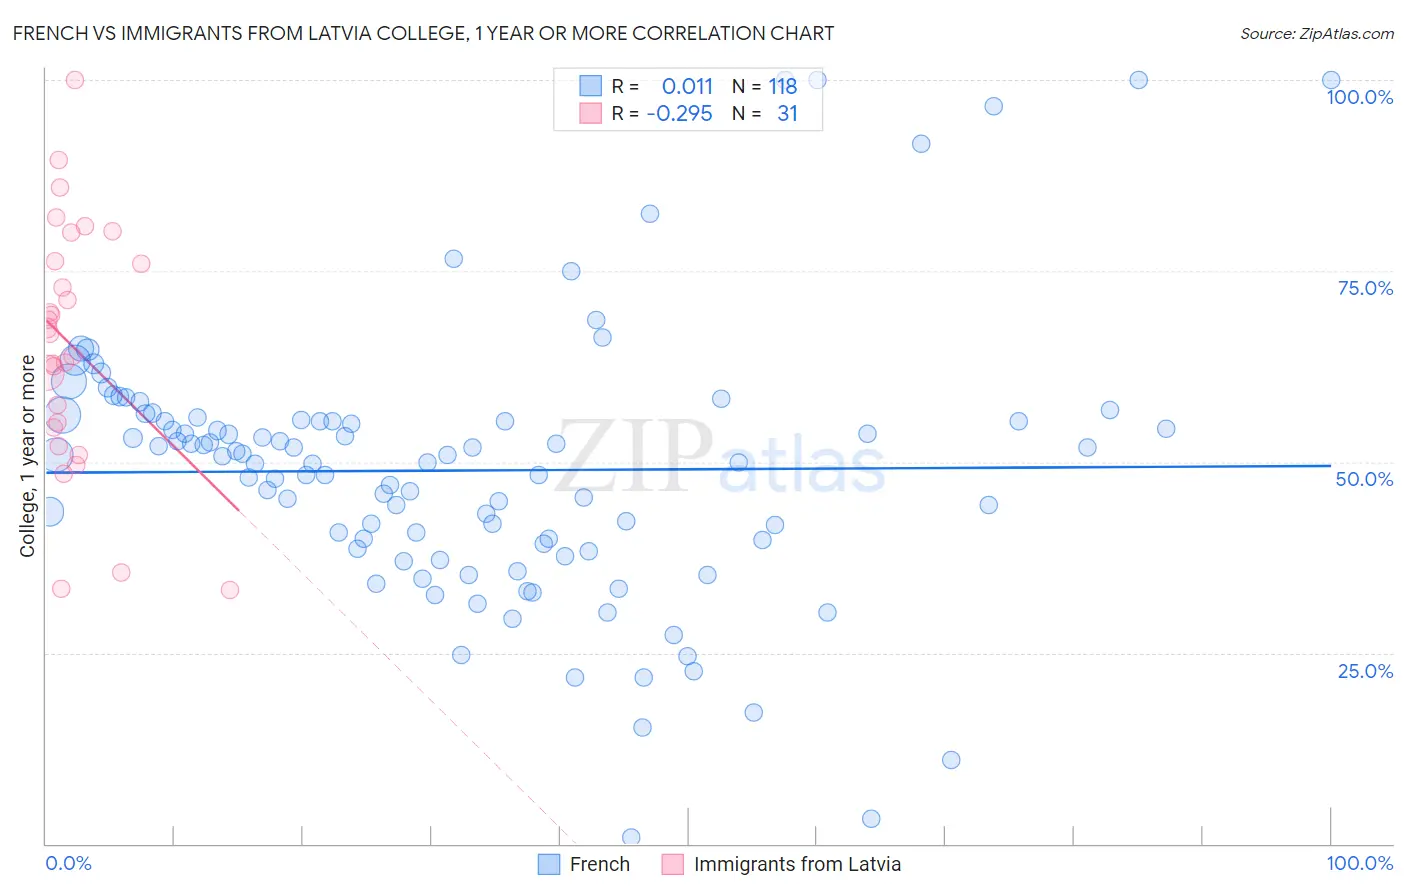
French vs Immigrants from Latvia College, 1 year or more Correlation Chart
The statistical analysis conducted on geographies consisting of 572,417,926 people shows no correlation between the proportion of French and percentage of population with at least college, 1 year or more education in the United States with a correlation coefficient (R) of 0.011 and weighted average of 58.9%. Similarly, the statistical analysis conducted on geographies consisting of 113,735,345 people shows a weak negative correlation between the proportion of Immigrants from Latvia and percentage of population with at least college, 1 year or more education in the United States with a correlation coefficient (R) of -0.295 and weighted average of 64.8%, a difference of 10.0%.
College, 1 year or more Correlation Summary
| Measurement | French | Immigrants from Latvia |
| Minimum | 0.78% | 33.2% |
| Maximum | 100.0% | 100.0% |
| Range | 99.2% | 66.8% |
| Mean | 48.9% | 65.2% |
| Median | 50.4% | 66.8% |
| Interquartile 25% (IQ1) | 39.3% | 54.4% |
| Interquartile 75% (IQ3) | 55.4% | 76.2% |
| Interquartile Range (IQR) | 16.1% | 21.8% |
| Standard Deviation (Sample) | 17.8% | 16.0% |
| Standard Deviation (Population) | 17.7% | 15.8% |
Similar Demographics by College, 1 year or more
Demographics Similar to French by College, 1 year or more
In terms of college, 1 year or more, the demographic groups most similar to French are Scotch-Irish (58.9%, a difference of 0.020%), German (58.9%, a difference of 0.020%), South American (59.0%, a difference of 0.090%), Uruguayan (58.8%, a difference of 0.15%), and Immigrants from Cameroon (58.8%, a difference of 0.19%).
| Demographics | Rating | Rank | College, 1 year or more |
| Swiss | 43.4 /100 | #181 | Average 59.2% |
| Immigrants | Bosnia and Herzegovina | 42.8 /100 | #182 | Average 59.2% |
| German Russians | 39.3 /100 | #183 | Fair 59.1% |
| Spaniards | 38.3 /100 | #184 | Fair 59.0% |
| South Americans | 35.9 /100 | #185 | Fair 59.0% |
| Scotch-Irish | 34.7 /100 | #186 | Fair 58.9% |
| Germans | 34.7 /100 | #187 | Fair 58.9% |
| French | 34.4 /100 | #188 | Fair 58.9% |
| Uruguayans | 31.8 /100 | #189 | Fair 58.8% |
| Immigrants | Cameroon | 31.2 /100 | #190 | Fair 58.8% |
| Immigrants | Philippines | 29.2 /100 | #191 | Fair 58.7% |
| Colombians | 27.6 /100 | #192 | Fair 58.7% |
| Peruvians | 27.5 /100 | #193 | Fair 58.6% |
| Costa Ricans | 26.4 /100 | #194 | Fair 58.6% |
| Dutch | 26.2 /100 | #195 | Fair 58.6% |
Demographics Similar to Immigrants from Latvia by College, 1 year or more
In terms of college, 1 year or more, the demographic groups most similar to Immigrants from Latvia are Mongolian (64.8%, a difference of 0.010%), Immigrants from Russia (64.7%, a difference of 0.12%), Immigrants from Norway (64.7%, a difference of 0.14%), Immigrants from Kuwait (65.0%, a difference of 0.21%), and Estonian (65.0%, a difference of 0.27%).
| Demographics | Rating | Rank | College, 1 year or more |
| Immigrants | Turkey | 99.9 /100 | #35 | Exceptional 65.2% |
| Immigrants | South Africa | 99.9 /100 | #36 | Exceptional 65.1% |
| Russians | 99.9 /100 | #37 | Exceptional 65.1% |
| Immigrants | Saudi Arabia | 99.9 /100 | #38 | Exceptional 65.0% |
| Estonians | 99.9 /100 | #39 | Exceptional 65.0% |
| Immigrants | Kuwait | 99.9 /100 | #40 | Exceptional 65.0% |
| Mongolians | 99.9 /100 | #41 | Exceptional 64.8% |
| Immigrants | Latvia | 99.9 /100 | #42 | Exceptional 64.8% |
| Immigrants | Russia | 99.9 /100 | #43 | Exceptional 64.7% |
| Immigrants | Norway | 99.9 /100 | #44 | Exceptional 64.7% |
| Immigrants | Lithuania | 99.9 /100 | #45 | Exceptional 64.6% |
| Bhutanese | 99.9 /100 | #46 | Exceptional 64.6% |
| Australians | 99.9 /100 | #47 | Exceptional 64.6% |
| Immigrants | Bulgaria | 99.9 /100 | #48 | Exceptional 64.6% |
| New Zealanders | 99.9 /100 | #49 | Exceptional 64.6% |