Hawaiian vs Immigrants from Latvia Single Father Poverty
COMPARE
Hawaiian
Immigrants from Latvia
Single Father Poverty
Single Father Poverty Comparison
Hawaiians
Immigrants from Latvia
15.1%
SINGLE FATHER POVERTY
99.9/ 100
METRIC RATING
58th/ 347
METRIC RANK
15.8%
SINGLE FATHER POVERTY
94.7/ 100
METRIC RATING
112th/ 347
METRIC RANK
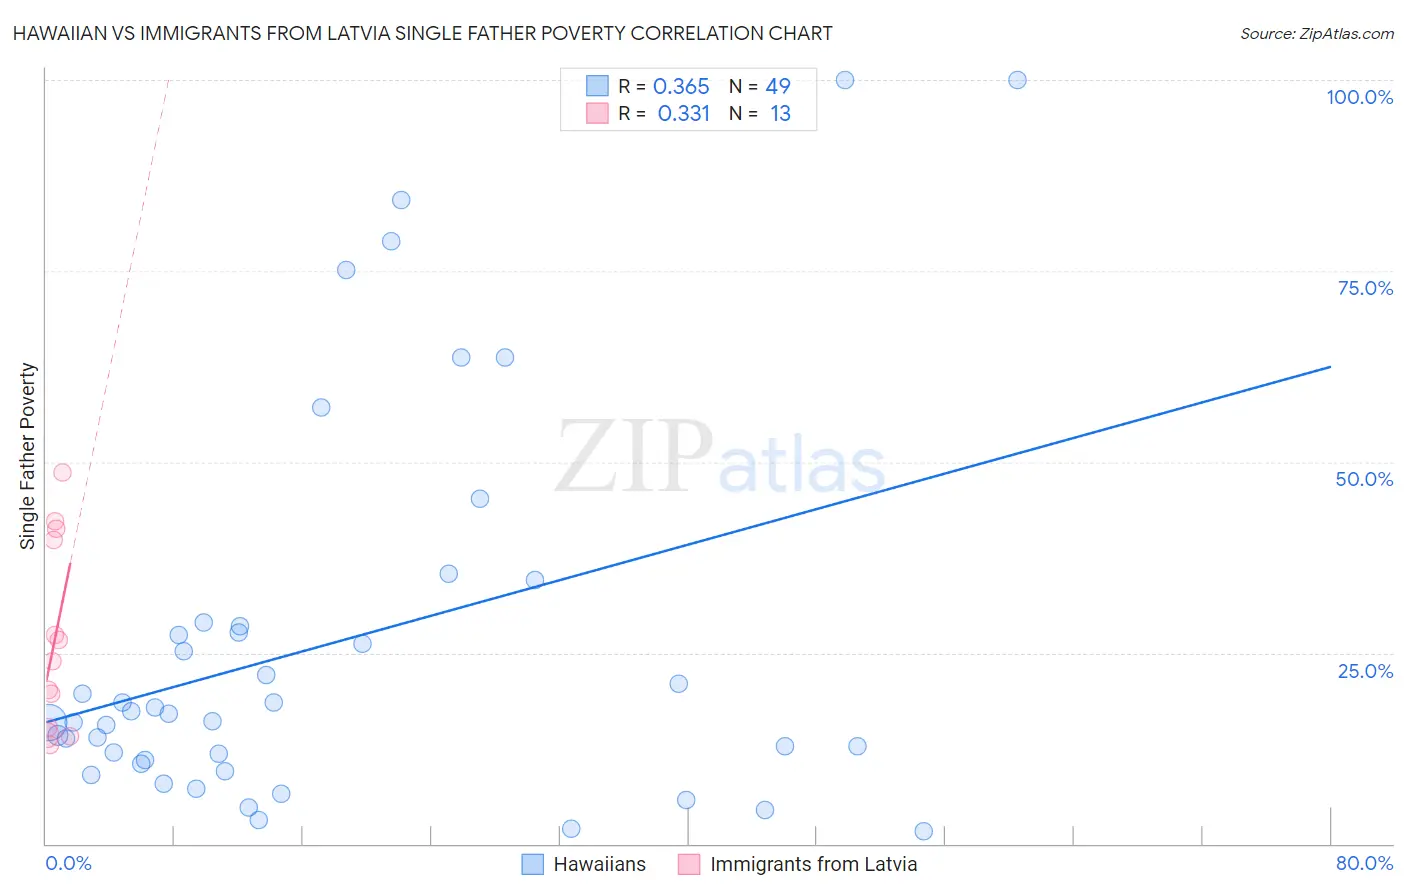
Hawaiian vs Immigrants from Latvia Single Father Poverty Correlation Chart
The statistical analysis conducted on geographies consisting of 272,607,469 people shows a mild positive correlation between the proportion of Hawaiians and poverty level among single fathers in the United States with a correlation coefficient (R) of 0.365 and weighted average of 15.1%. Similarly, the statistical analysis conducted on geographies consisting of 98,106,099 people shows a mild positive correlation between the proportion of Immigrants from Latvia and poverty level among single fathers in the United States with a correlation coefficient (R) of 0.331 and weighted average of 15.8%, a difference of 4.6%.
Single Father Poverty Correlation Summary
| Measurement | Hawaiian | Immigrants from Latvia |
| Minimum | 1.7% | 12.9% |
| Maximum | 100.0% | 48.6% |
| Range | 98.3% | 35.7% |
| Mean | 26.3% | 26.6% |
| Median | 17.0% | 23.9% |
| Interquartile 25% (IQ1) | 10.7% | 14.7% |
| Interquartile 75% (IQ3) | 28.7% | 40.4% |
| Interquartile Range (IQR) | 18.0% | 25.7% |
| Standard Deviation (Sample) | 25.4% | 12.4% |
| Standard Deviation (Population) | 25.2% | 11.9% |
Similar Demographics by Single Father Poverty
Demographics Similar to Hawaiians by Single Father Poverty
In terms of single father poverty, the demographic groups most similar to Hawaiians are Laotian (15.1%, a difference of 0.060%), Guamanian/Chamorro (15.1%, a difference of 0.10%), Immigrants from Laos (15.1%, a difference of 0.14%), Immigrants from Bulgaria (15.0%, a difference of 0.42%), and Immigrants from Uzbekistan (15.0%, a difference of 0.47%).
| Demographics | Rating | Rank | Single Father Poverty |
| Immigrants | Pakistan | 99.9 /100 | #51 | Exceptional 15.0% |
| Immigrants | El Salvador | 99.9 /100 | #52 | Exceptional 15.0% |
| Immigrants | Kenya | 99.9 /100 | #53 | Exceptional 15.0% |
| Immigrants | Uzbekistan | 99.9 /100 | #54 | Exceptional 15.0% |
| Immigrants | Bulgaria | 99.9 /100 | #55 | Exceptional 15.0% |
| Immigrants | Laos | 99.9 /100 | #56 | Exceptional 15.1% |
| Laotians | 99.9 /100 | #57 | Exceptional 15.1% |
| Hawaiians | 99.9 /100 | #58 | Exceptional 15.1% |
| Guamanians/Chamorros | 99.9 /100 | #59 | Exceptional 15.1% |
| Puget Sound Salish | 99.8 /100 | #60 | Exceptional 15.2% |
| Immigrants | Bosnia and Herzegovina | 99.8 /100 | #61 | Exceptional 15.2% |
| Immigrants | Armenia | 99.8 /100 | #62 | Exceptional 15.2% |
| Immigrants | Sweden | 99.8 /100 | #63 | Exceptional 15.2% |
| Bangladeshis | 99.8 /100 | #64 | Exceptional 15.2% |
| Immigrants | Malaysia | 99.8 /100 | #65 | Exceptional 15.2% |
Demographics Similar to Immigrants from Latvia by Single Father Poverty
In terms of single father poverty, the demographic groups most similar to Immigrants from Latvia are Bulgarian (15.8%, a difference of 0.030%), Danish (15.8%, a difference of 0.040%), Argentinean (15.8%, a difference of 0.060%), Immigrants from Africa (15.8%, a difference of 0.080%), and Turkish (15.8%, a difference of 0.090%).
| Demographics | Rating | Rank | Single Father Poverty |
| Immigrants | Australia | 96.1 /100 | #105 | Exceptional 15.7% |
| Immigrants | Poland | 95.8 /100 | #106 | Exceptional 15.7% |
| Native Hawaiians | 95.8 /100 | #107 | Exceptional 15.7% |
| Pakistanis | 95.7 /100 | #108 | Exceptional 15.7% |
| Turks | 95.1 /100 | #109 | Exceptional 15.8% |
| Immigrants | Africa | 95.1 /100 | #110 | Exceptional 15.8% |
| Bulgarians | 94.8 /100 | #111 | Exceptional 15.8% |
| Immigrants | Latvia | 94.7 /100 | #112 | Exceptional 15.8% |
| Danes | 94.5 /100 | #113 | Exceptional 15.8% |
| Argentineans | 94.4 /100 | #114 | Exceptional 15.8% |
| Immigrants | Thailand | 93.6 /100 | #115 | Exceptional 15.8% |
| Immigrants | Argentina | 92.8 /100 | #116 | Exceptional 15.8% |
| Immigrants | Colombia | 92.6 /100 | #117 | Exceptional 15.8% |
| Immigrants | Eastern Europe | 92.5 /100 | #118 | Exceptional 15.8% |
| Immigrants | Belarus | 92.4 /100 | #119 | Exceptional 15.8% |